


Topper's Solved these Questions
DUAL NATURE OF RADIATION AND MATTER
MODERN PUBLICATION|Exercise COMPETITION FILE (OBJECTIVE TYPE QUESTIONS (INTEGER TYPE QUESTIONS))|9 VideosCURRENT ELECTRICITY
MODERN PUBLICATION|Exercise Chapter Practice Test|15 VideosELECTRIC CHARGES AND FIELDS
MODERN PUBLICATION|Exercise Chapter Practice Test|15 Videos
Similar Questions
Explore conceptually related problems
MODERN PUBLICATION-DUAL NATURE OF RADIATION AND MATTER -CHAPTER PRACTICE TEST
- Define the term 'stopping potential' in relation to photoelectric effe...
Text Solution
|
- How the kinetic energy of ejected electrons depends on the intensity o...
Text Solution
|
- A proton and an electron have same velocity. Which one has greater de ...
Text Solution
|
- What would be the de Broglie wavelength of an electron possessing 100 ...
Text Solution
|
- Find the momentum of a wavelength 0.03Å if planck's constant is h.
Text Solution
|
- (a) Why photoelectric effect cannot be explained on the basis of wave ...
Text Solution
|
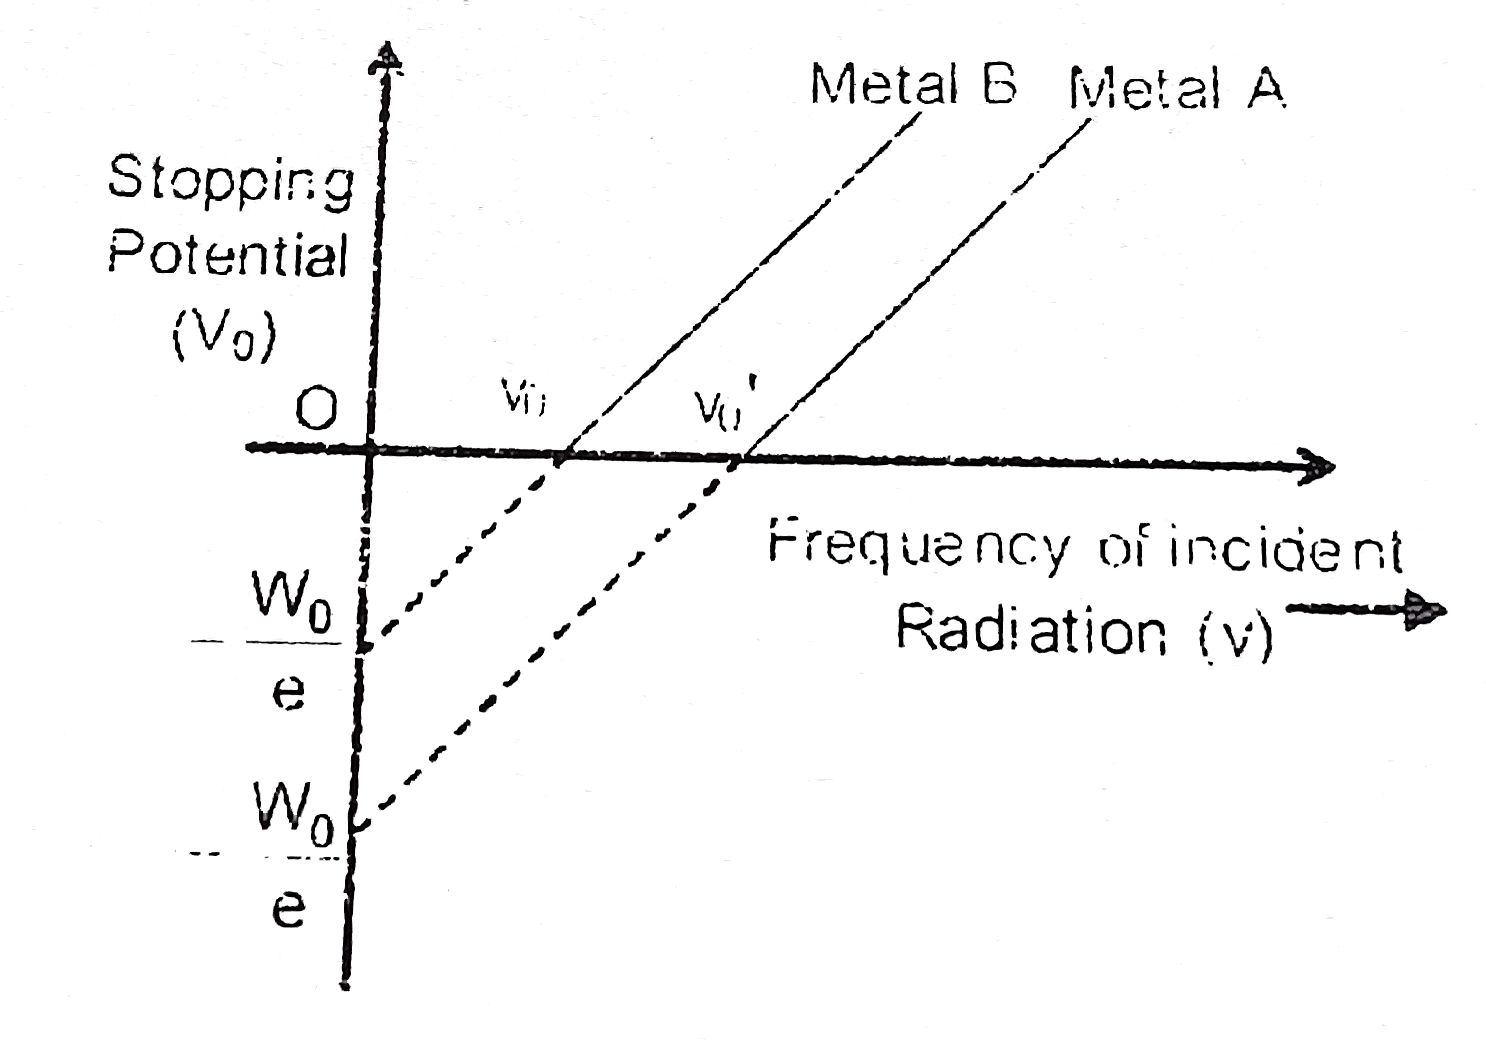
- The graph shows variation of stopping potential V(0) versus frequency ...
Text Solution
|
- Plot a graph showing variation of de-broglie wavelength lambda versus ...
Text Solution
|
- A photon and an elecron have the same de Broglie wavelength. Which has...
Text Solution
|
- Show that the do Broglie wavelength lamda of an electron of energy ...
Text Solution
|
- Define threshold frequency and work function of a metal. Show that do ...
Text Solution
|
- Light of intensity I and frequency nu is incident on a photosensitive ...
Text Solution
|
- Write the three characteristic features in photoelectric effect which...
Text Solution
|
- In a plot of photoelectric current versus anode potential, how does ...
Text Solution
|
- An electron microscope uses electrons accelerated by a voltage of 50kV...
Text Solution
|