


Similar Questions
Explore conceptually related problems
Recommended Questions
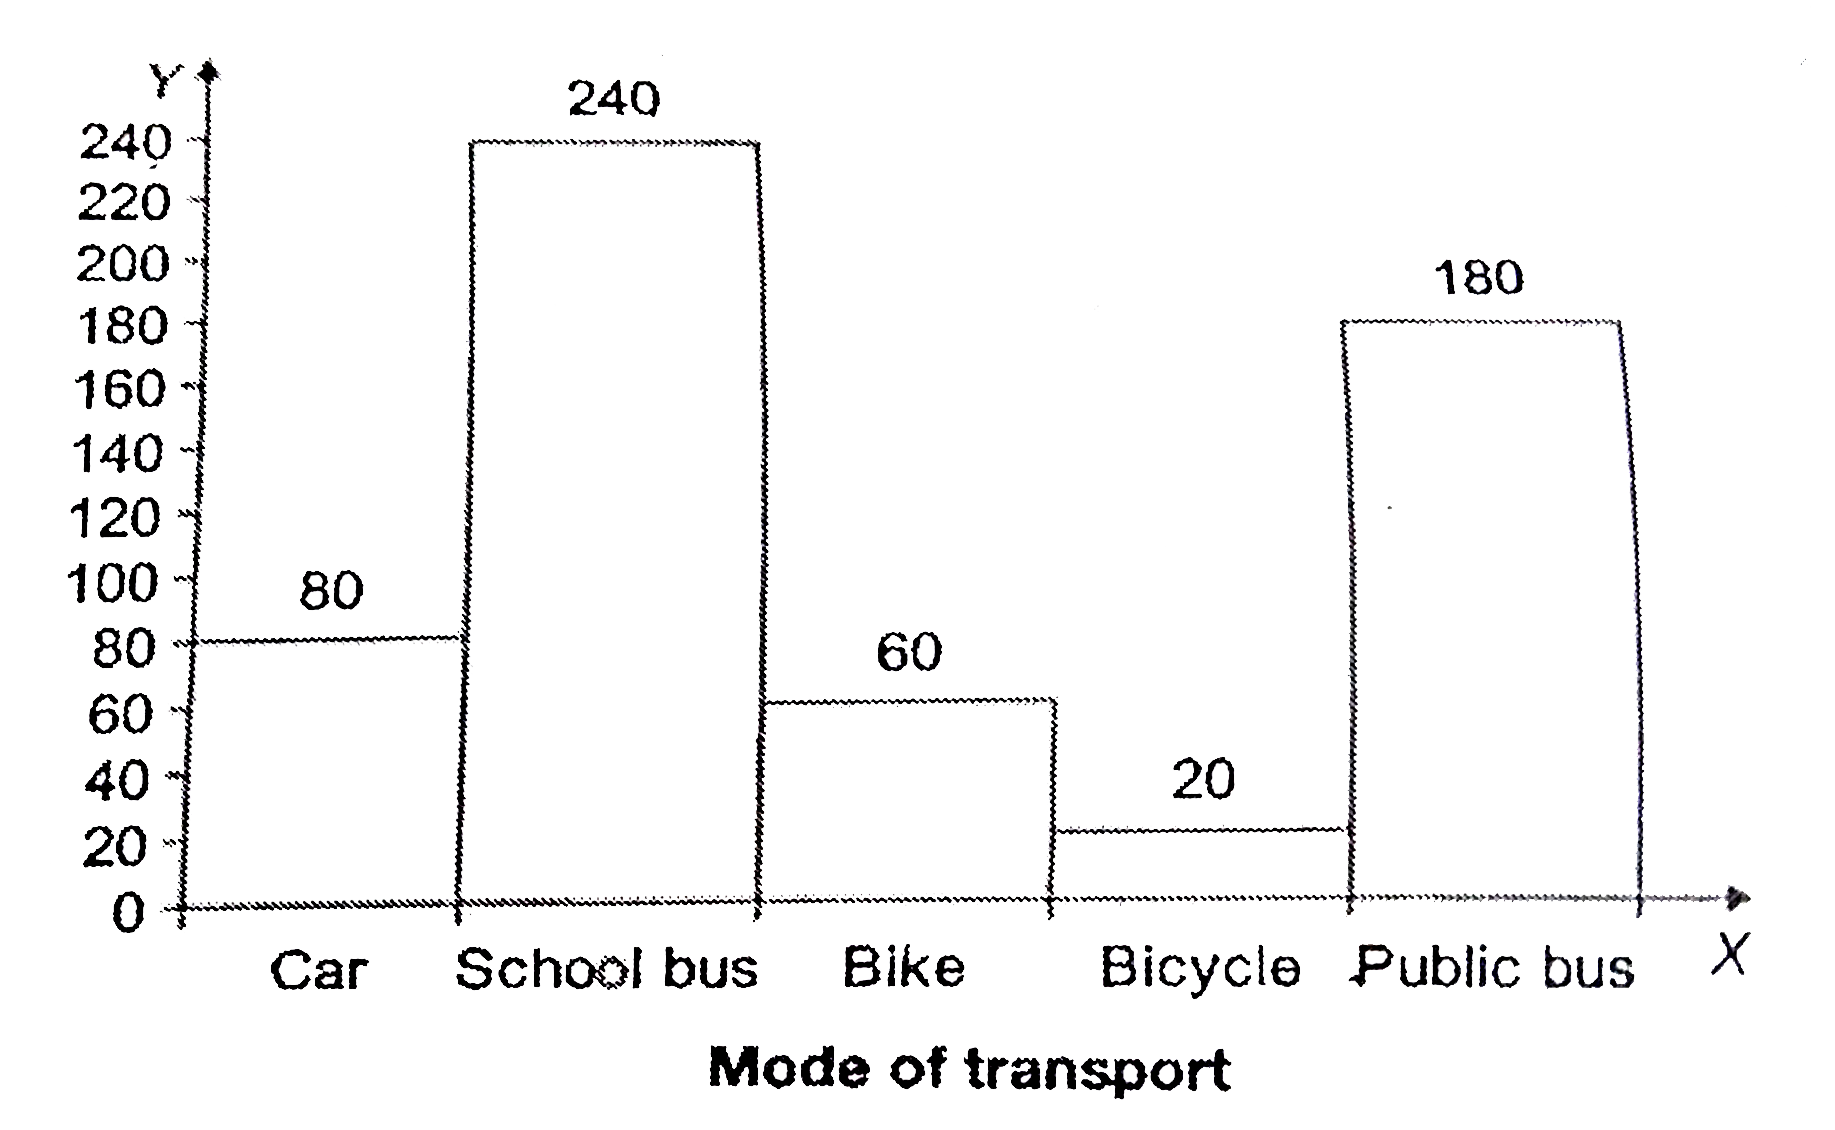
- The histogram shows the number of students using different modes of tr...
Text Solution
|
- The histogram shows the number of students using different modes of tr...
Text Solution
|
- The histogram shows the number of students using different modes of tr...
Text Solution
|
- The histogram shows the number of students using different modes of tr...
Text Solution
|
- The histogram shows the number of students using different modes of tr...
Text Solution
|
- The histogram shows the number of students using different modes of tr...
Text Solution
|
- Determine the point of symmetry of a regular hexagon. <img src="htt...
Text Solution
|
- Dtermine the images of the following figure about the given line : ...
Text Solution
|
- Match the following Column A to Column B
Text Solution
|