Home
Class 11
PHYSICS
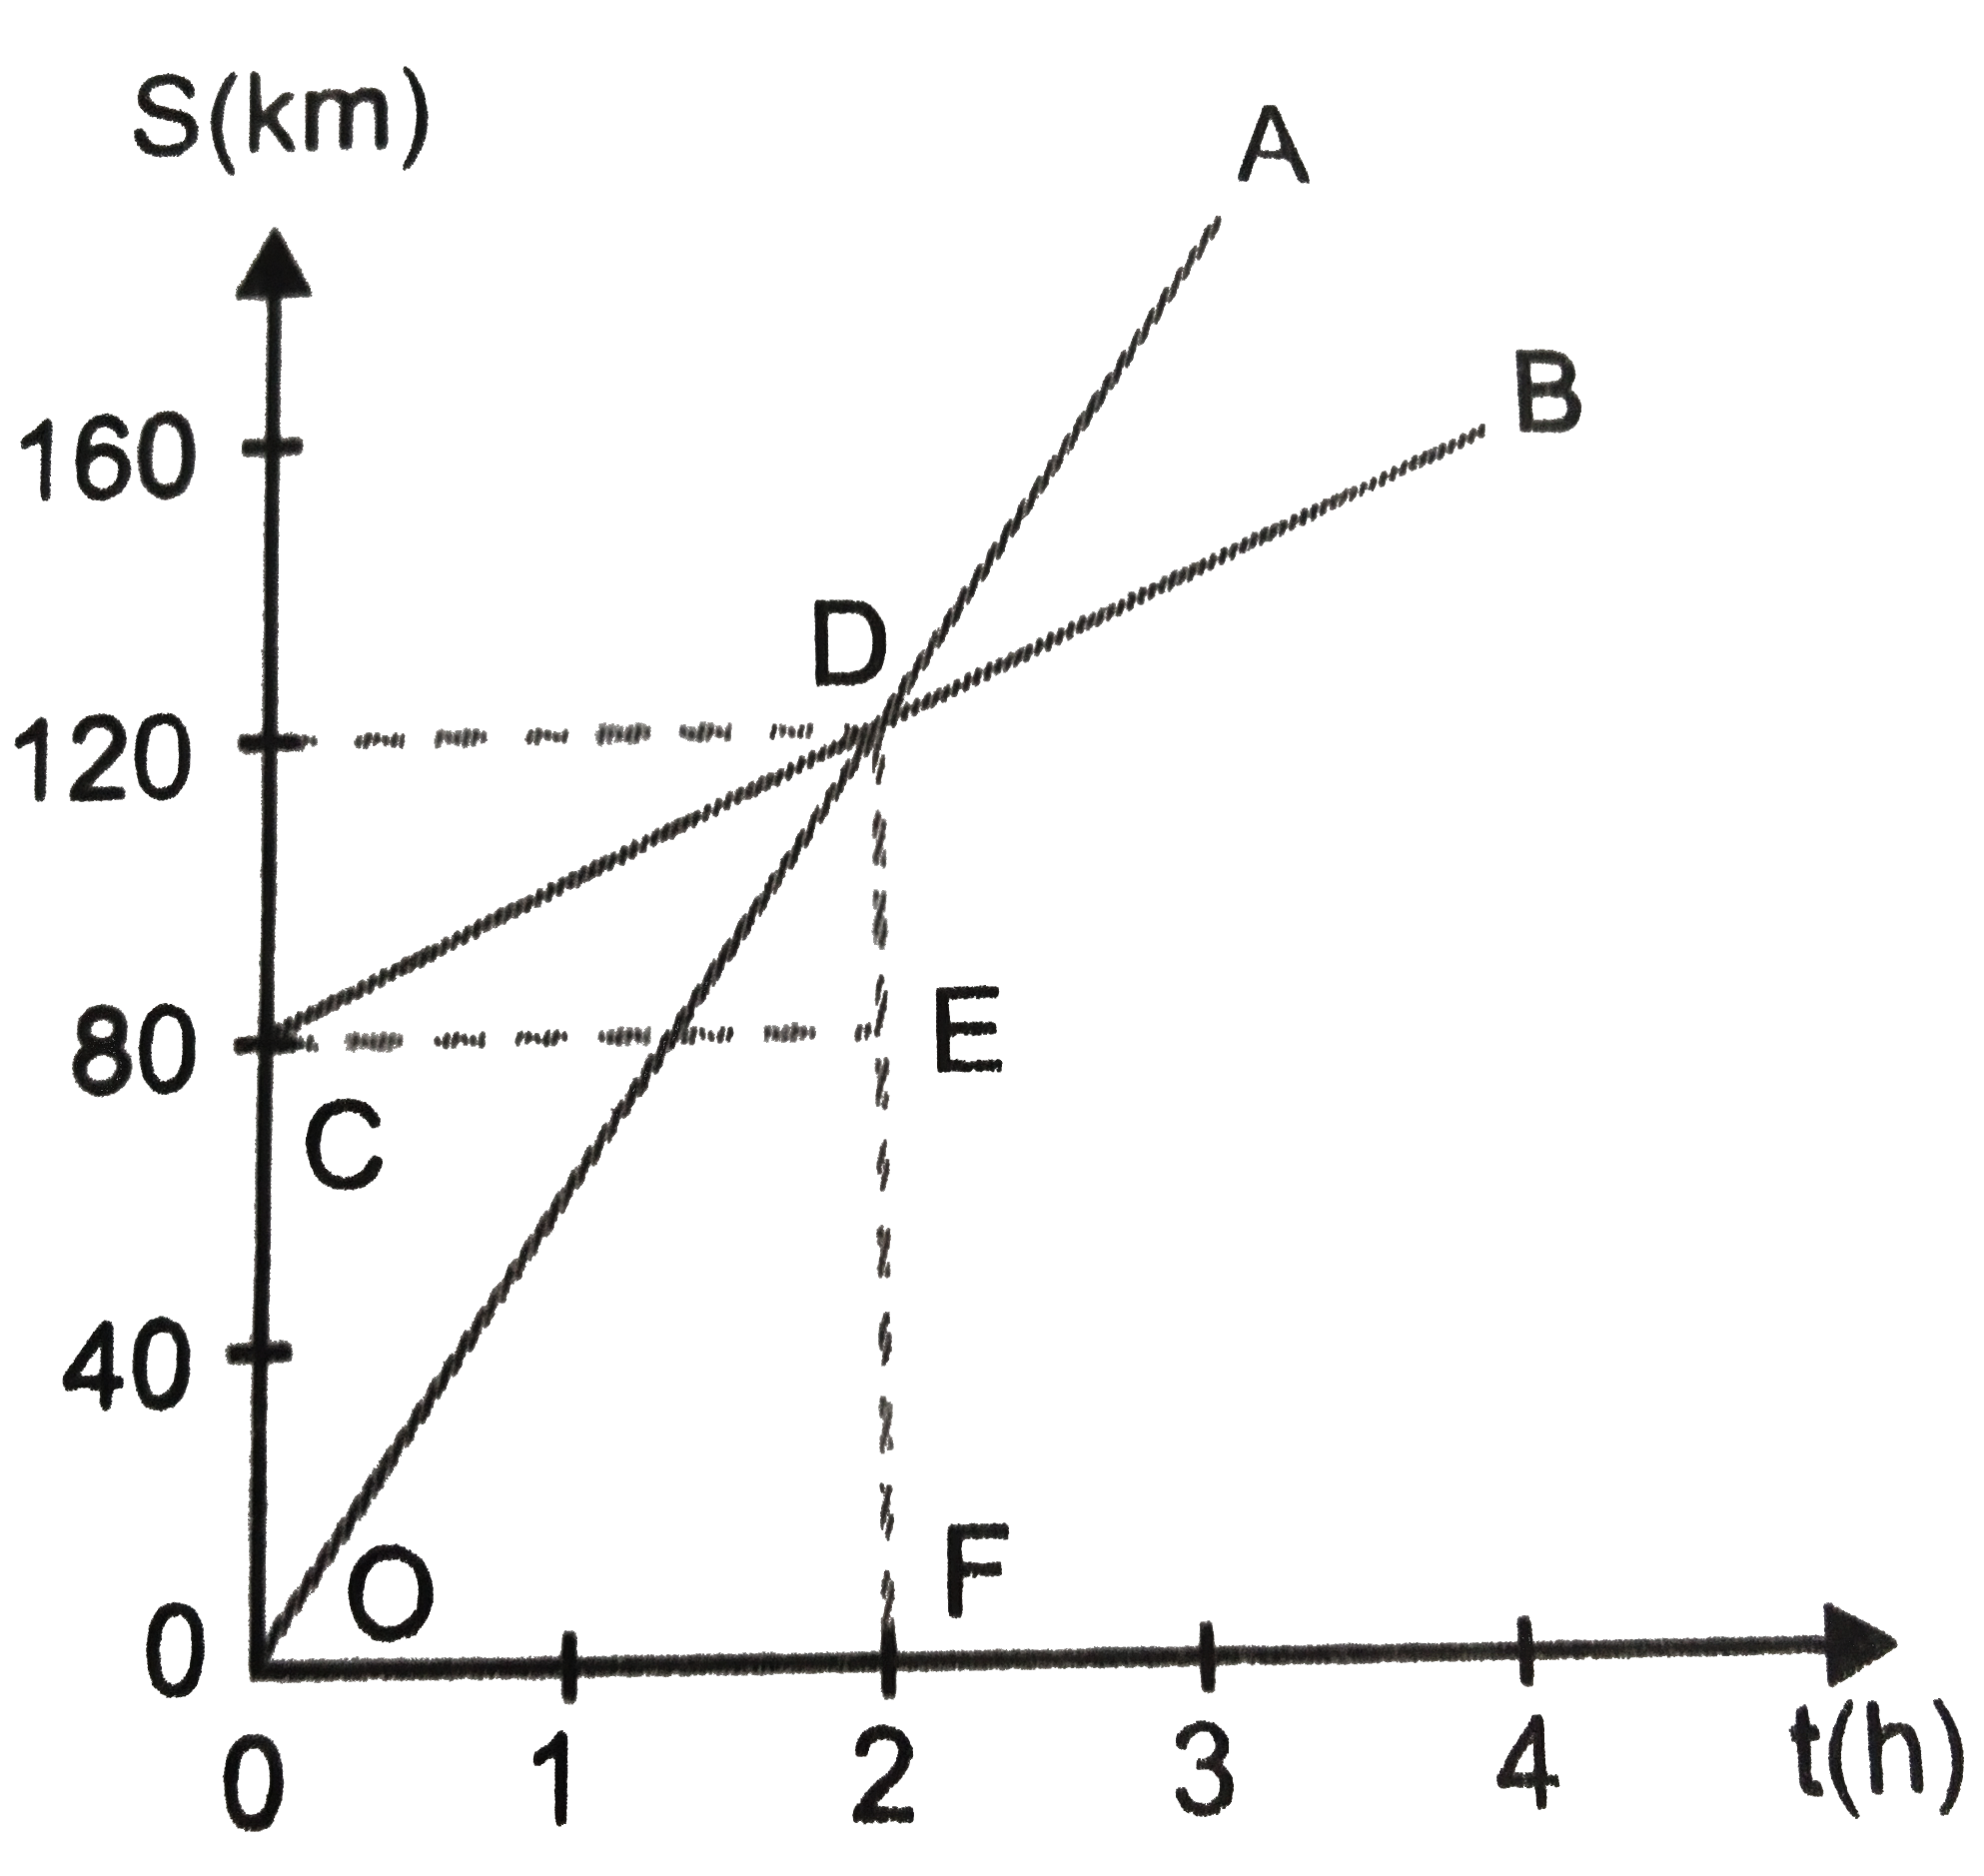
Fig. 2 (b). 12 shows thae distance (S) -...

Fig. 2 (b). 12` shows thae distance (S) -time (t) graphs of two trains, which start moving simultaneously in the same direetion. From the graphs, find:
.
(a) How much (B) is ahead of (A) when motion starts
(b) What is the speed of (B) ?
( c) What and where (A) will catch (B) ? `
(d) What is the differnce in speeds of (A) and (B) ? lt

Promotional Banner

Similar Questions

Explore conceptually related problems

Figure shows the distance-time graph for the motion of two vehicles A and B. Which one of them is moving faster? Distance-time graph for the motion of two cars

Fig 2.26 shows the displacement-time graph for the motion of two boys A and B along a straight road in the same direction. Answer the following: (i) When did B start after A ? (ii) How far away was A from B when B started? (iii) Which of the two has greater velocity ? (iv) When and where did B overtake A ?

A velocity-time graph of two vehicals A & B starting from rest at the same time is given in the figure. The statements which is correct from graph.

A velocity-time graph of two vehicals A & B starting from rest at the same time is given in the figure. The statements which is correct from graph.

Fig 1.11 show the distance - time graphs of three A,B and C. Study the graph and answer the following question : How far has C travelled when B passes A ?

Fig 1.11 show the distance - time graphs of three A,B and C. Study the graph and answer the following question : How far has C travelled when B passes A ?

The speed time graph of a particle moving along a fixed direction is as shown in the figure. Obtain the distance travelled by the particle from, (a) t = 0 to 10s (b) t= 2s to 6s (c) What is the average speed of the particle over the intervals in (a) and (b)?