A
B
C
D
Text Solution
Verified by Experts
The correct Answer is:


Topper's Solved these Questions
STATES OF MATTER
MODERN PUBLICATION|Exercise MULTIPLE CHOICE QUESTIONS (LEVEL-II)|95 VideosSTATES OF MATTER
MODERN PUBLICATION|Exercise MULTIPLE CHOICE QUESTIONS (LEVEL-III)|7 VideosSOME BASIC CONCEPTS OF CHEMISTRY
MODERN PUBLICATION|Exercise RECENT EXAMINATION QUESTION|15 VideosSTRUCTURE OF ATOM
MODERN PUBLICATION|Exercise RECENT EXAMINATION QUESTIONS|11 Videos
Similar Questions
Explore conceptually related problems
MODERN PUBLICATION-STATES OF MATTER-RECENT EXAMINATION QUESTIONS
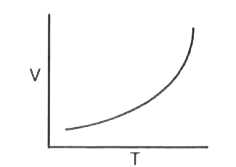
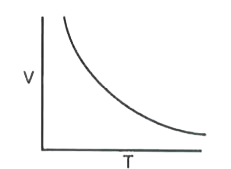
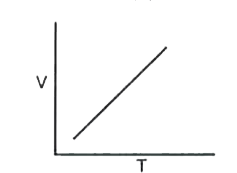
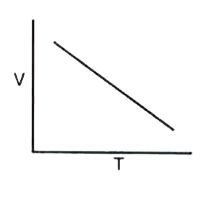
- A graph showing the variation of volume with temperture at constant pr...
Text Solution
|
- The pressure and temperature of 4 dm^(3) of carbon dioxide gas are dou...
Text Solution
|
- Hydrogen diffuses six times faster than the gas A. The molar mass of g...
Text Solution
|
- A gas deviates from ideal behaviour at a high pressure because its mol...
Text Solution
|
- In order to increase the volume of a gas by 10%, the pressure of the g...
Text Solution
|
- Cooking is fast in a pressure cooker because :
Text Solution
|
- The r.m.s. velocity of molecules of a gas of density 4kg //m^(3) and p...
Text Solution
|
- 0.5 mol each of H(2), SO(2) and CH(4) are ketp in a container. A hole ...
Text Solution
|
- For one mole of an ideal gas, increasing the temperature from 10^(@)C ...
Text Solution
|
- The r.m.s. velocity of hydrogen is sqrt( 7) times the r.m.s. velocity ...
Text Solution
|
- Which of the following gases has the highest value of r.m.s. velocity ...
Text Solution
|
- Density of carbon monoxide is maximum at
Text Solution
|
- Plat of Maxwell.s distribution of velocities is gives below : W...
Text Solution
|