A
B
C
D
Text Solution
Verified by Experts
The correct Answer is:


Similar Questions
Explore conceptually related problems
Recommended Questions
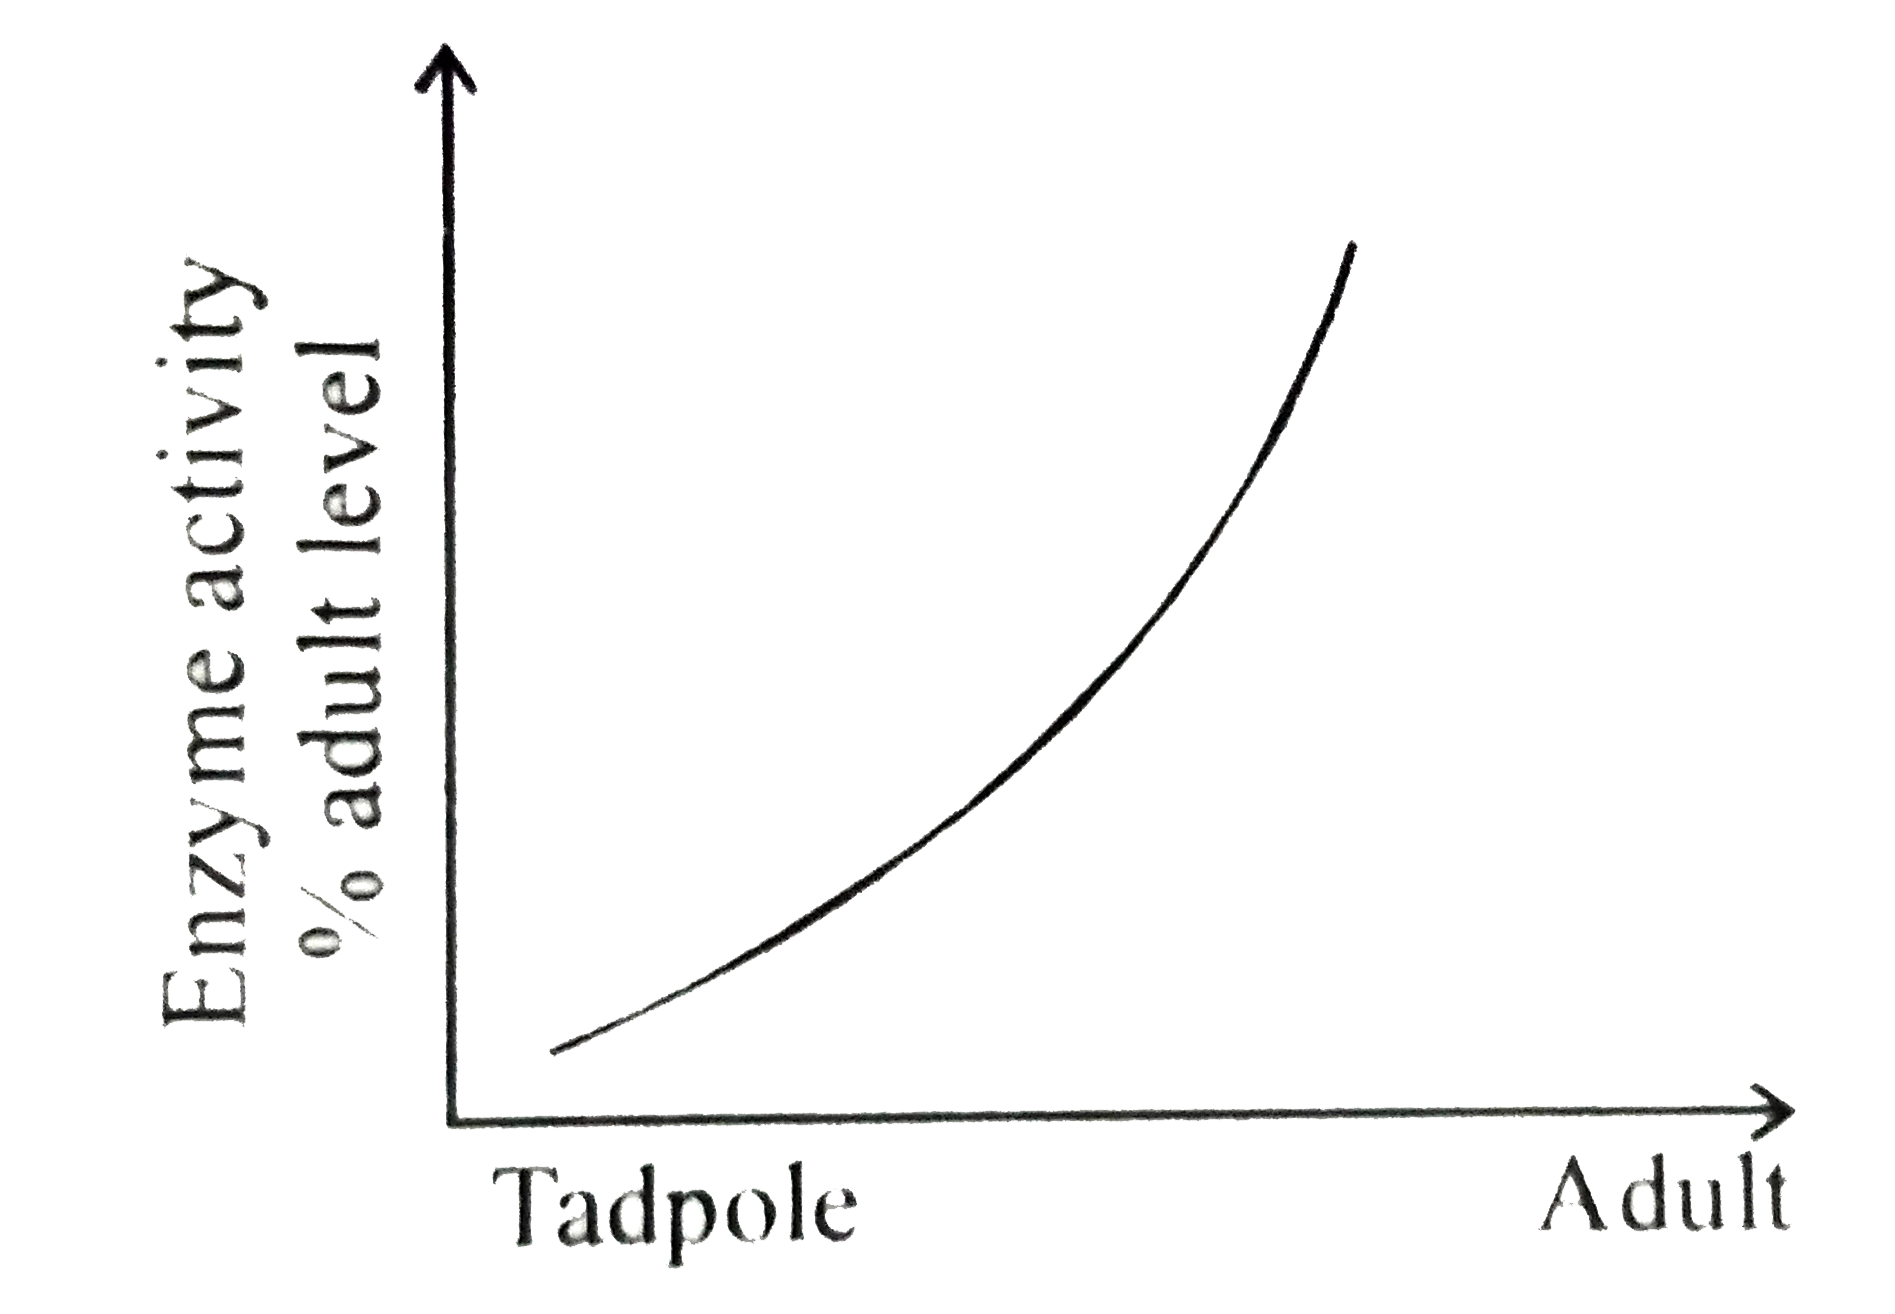
- Graph depicts the concentration of enzymes involved in urea synthesis ...
Text Solution
|
- Presence of gills in the tadpole of from indicates that
Text Solution
|
- The given graph shows the effect of substrate concentration on the rat...
Text Solution
|
- The given graph shows the effect of substrate concentration on the ra...
Text Solution
|
- [A]: A tadpole whose thyroid gland has been removed does not metamorph...
Text Solution
|
- The given graph shows the effect of substrate concentration on the rat...
Text Solution
|
- प्रकाश संश्लेषण में ग्लूकोस के प्रत्येमागणु यो सरलेषण में सन्निहित हैं
Text Solution
|
- नीचे ग्राफ चित्रित किया गया है क्योंकि मेंढक को विकासशील बच्चे में यूर...
Text Solution
|
- Synthesis of ATP by enzymes present on thylakoids does not involve
Text Solution
|