


Similar Questions
Explore conceptually related problems
Recommended Questions
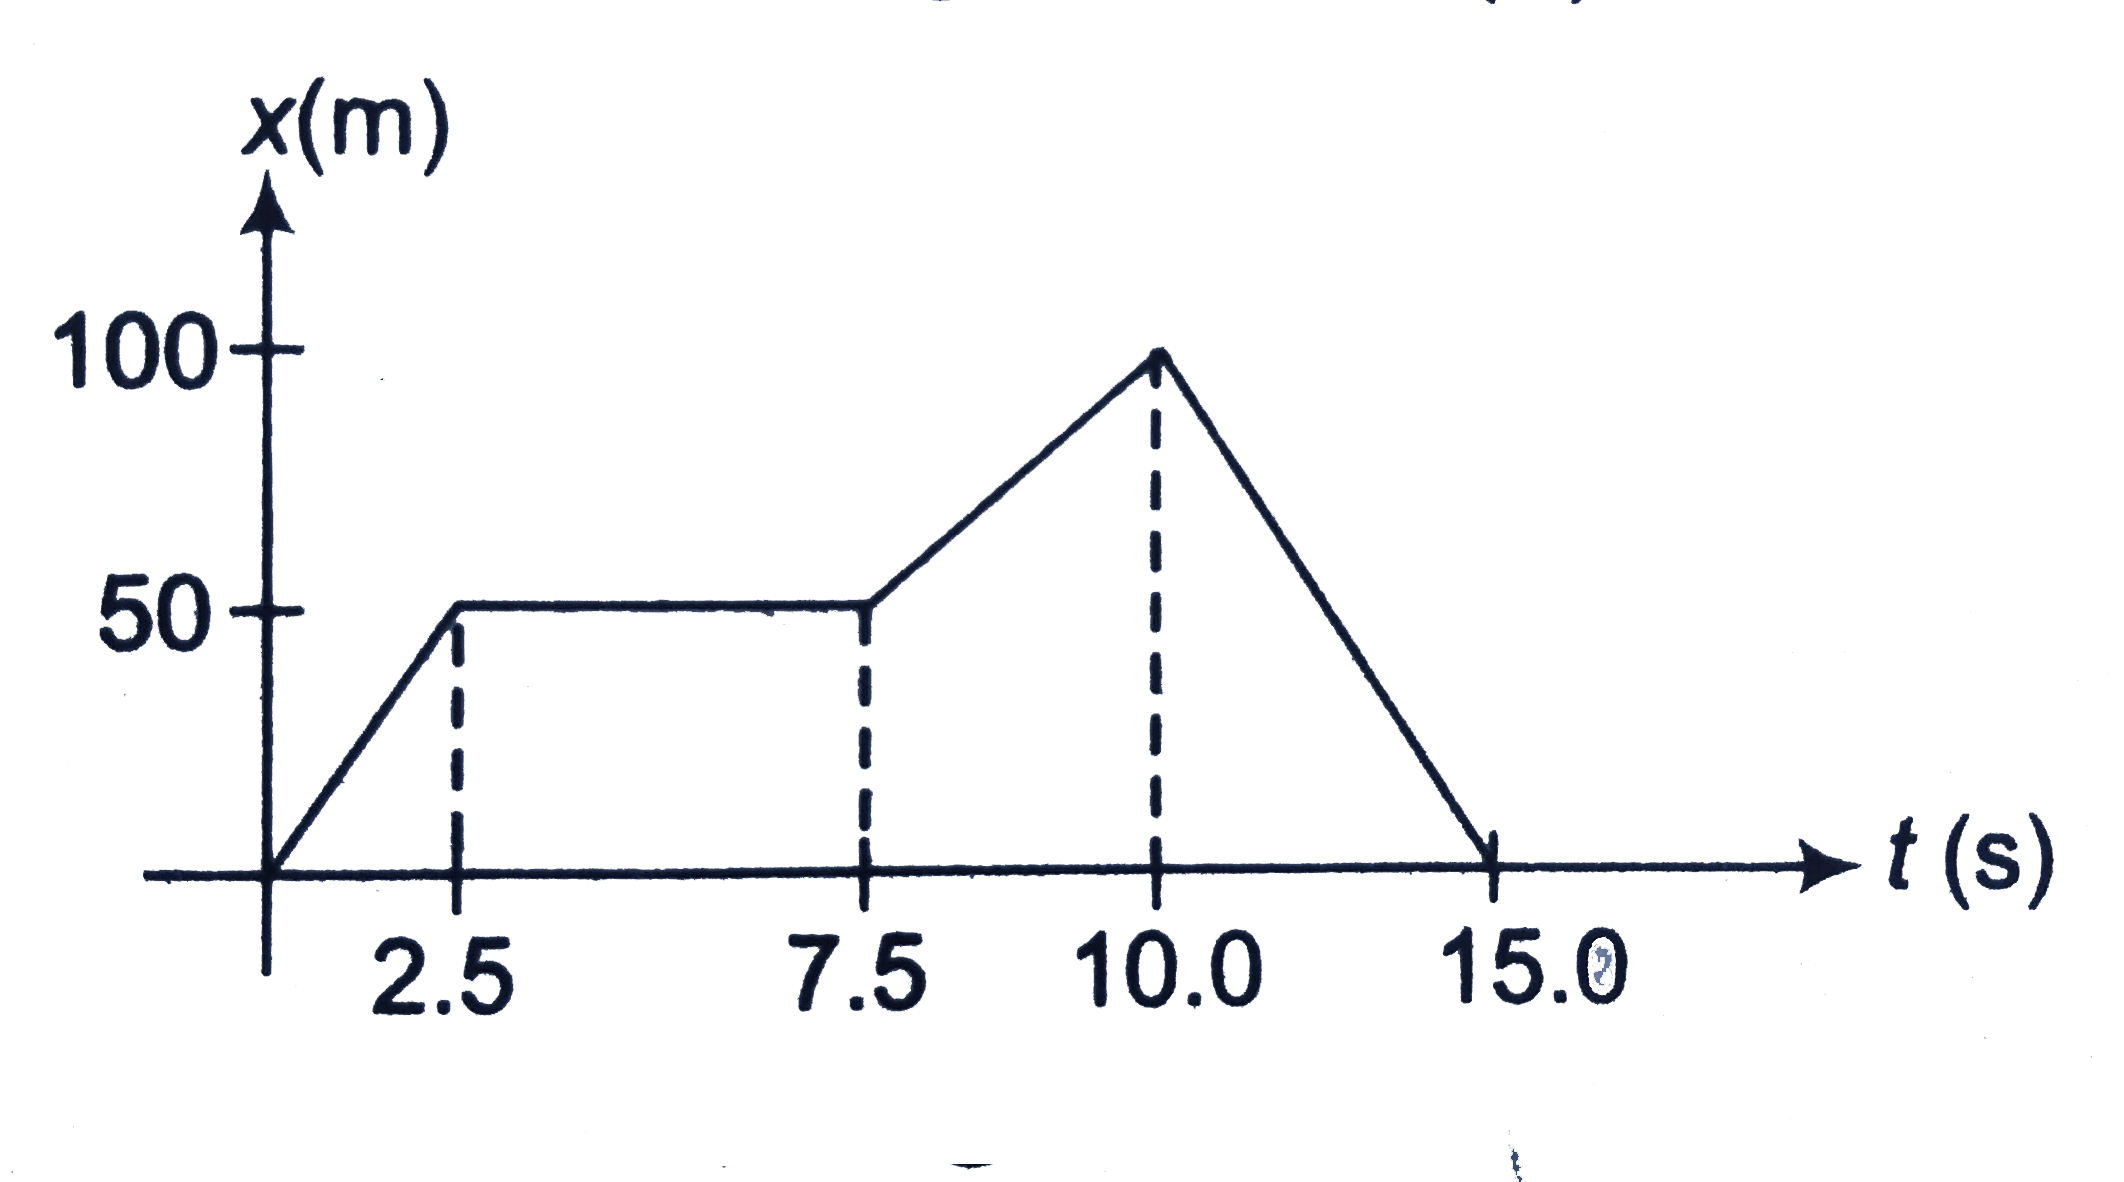
- Fig. shows the graph of the x-coordinate of a particle going along the...
Text Solution
|
- figure shows the graph of velocity versus tie for a particle going a...
Text Solution
|
- Figure shows the graph of the x-coordinaste of a particle going along ...
Text Solution
|
- Fig. shows the graph of velocity versus time for a partice going along...
Text Solution
|
- Fig. shows the graph of the x-coordinate of a particle going along the...
Text Solution
|
- The v-t graph for a particle moving along x-axis is shown in the figur...
Text Solution
|
- Figure shows the graph of x-coordinate of a particle moving along x-ax...
Text Solution
|
- चित्र में x - अक्ष पर चलते हुए एक कण का x - निर्देशांक समय ...
Text Solution
|
- Figure shows the graph of the x-co-ordinate of a particle going along ...
Text Solution
|