


Similar Questions
Explore conceptually related problems
Recommended Questions
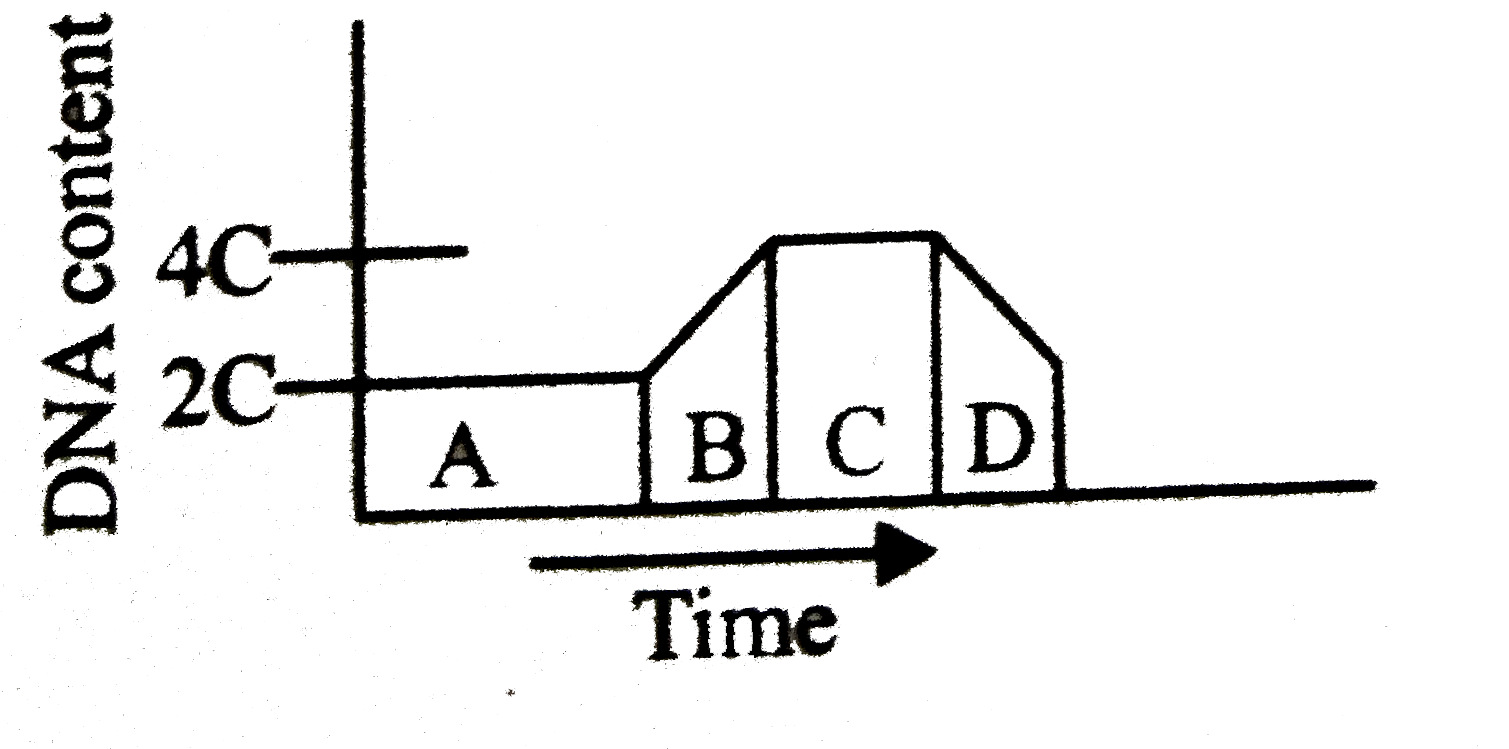
- The given graph shows the change in DNA content during various phases ...
Text Solution
|
- The given figure shows to phases, A and B of a typical angiospermic li...
Text Solution
|
- The given graph shows the change in DNA content during various phases ...
Text Solution
|
- Identify the given figures showing meiotic phases and select the corre...
Text Solution
|
- If DNA content of a dioploid cell is 'z' in the G(1) phase of the cell...
Text Solution
|
- A cell that is entering the mitotic phase (M-phase) of cell cycle is :...
Text Solution
|
- The following graphs (A and B) depicts changes in DNA Content during c...
Text Solution
|
- The given figure shows to phases, A and B of a typical angiospermic li...
Text Solution
|
- The given graph shows the change in DNA content during various phases ...
Text Solution
|