


Similar Questions
Explore conceptually related problems
Recommended Questions
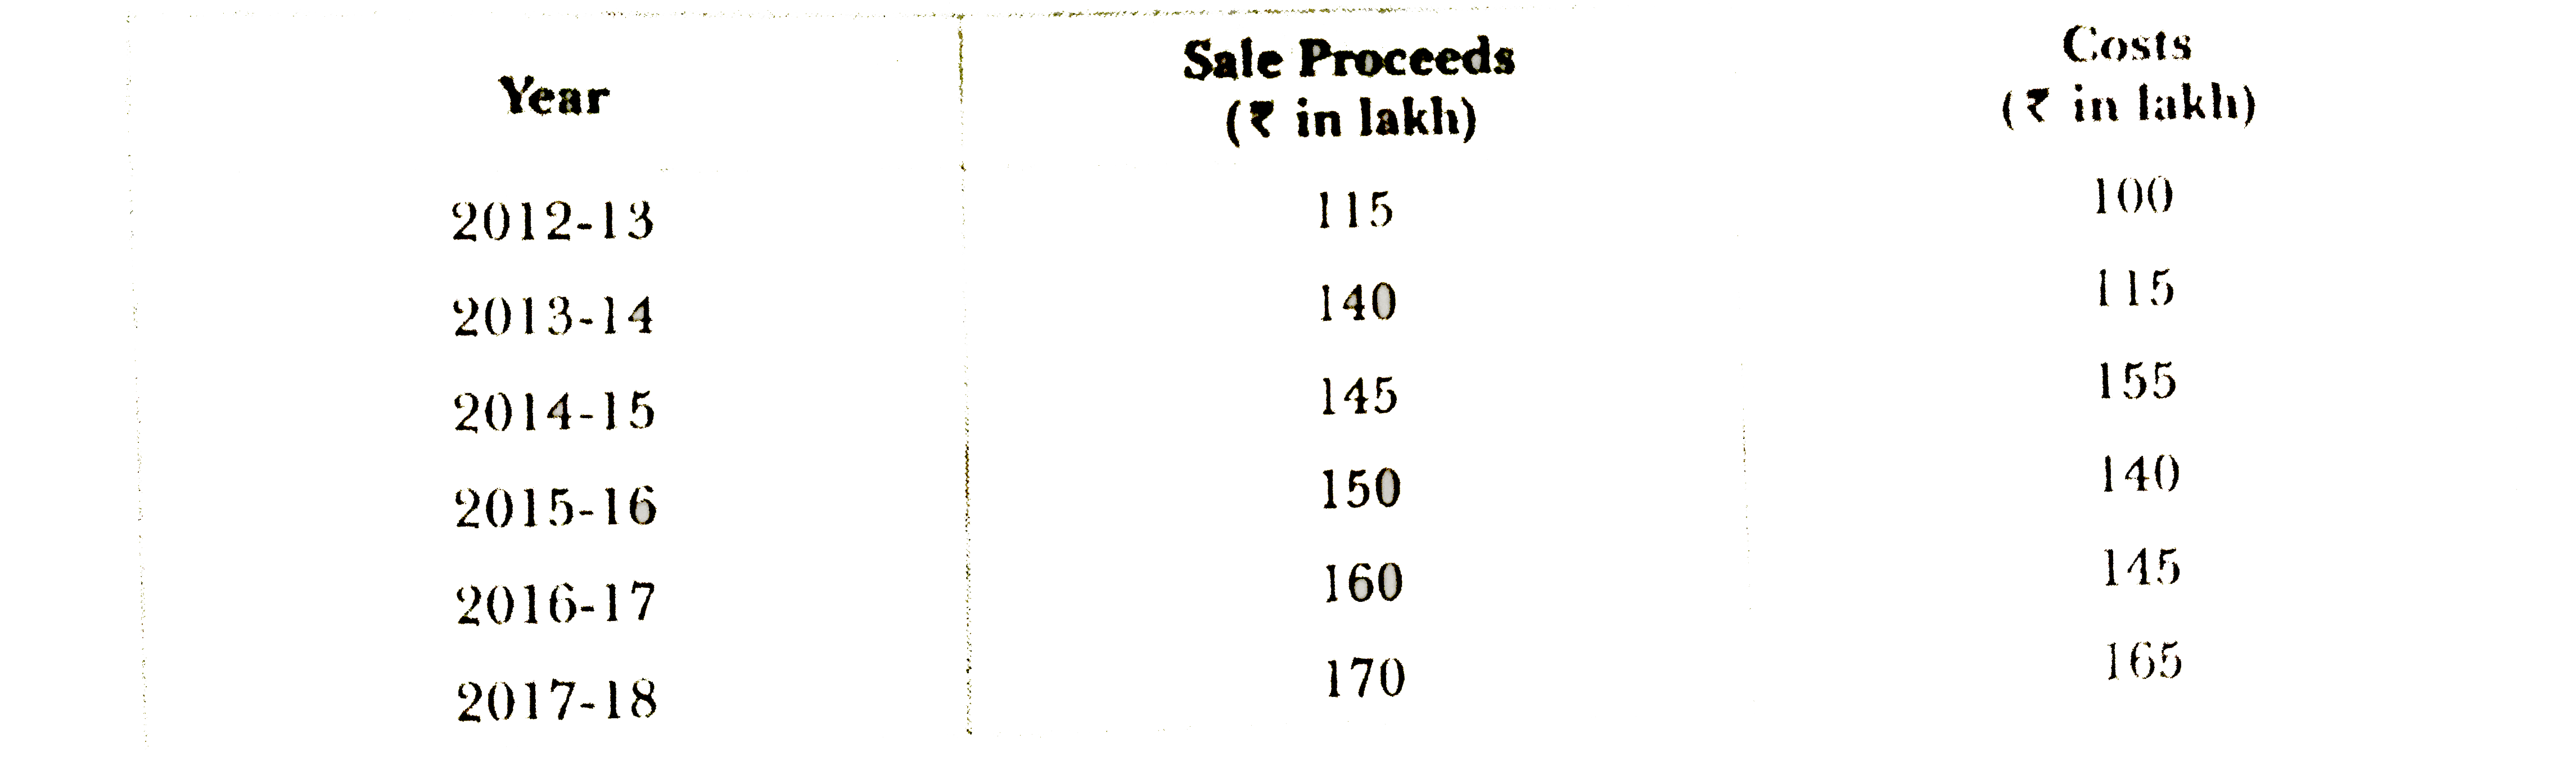
- Present the following data by a devidation bar diagram showning the di...
Text Solution
|
- वायरस तथा वाइरॉइड्स में अंतर् लिखिए!
Text Solution
|
- संजातता और समवर्तिता में अंतर् लिखिए!
Text Solution
|
- उपार्जित (कायिक) तथा जननिक विभिन्नताओं में अंतर् स्पष्ट कीजिए!
Text Solution
|
- संजात तथा समरूपता में अंतर लिखिए!
Text Solution
|
- दर्शाये गये परिपथ में a तथा b के मध्य विभवान्तर की गणना कीजिए ।
Text Solution
|
- खुले परिपथ में एक सेल की प्लेटों के बिच विभवान्तर 1.9 वोल्ट है । इस से...
Text Solution
|
- खुले परिपथ में एक सेल की प्लेटों के बिच विभवान्तर 1.9 वोल्ट है । इस खे...
Text Solution
|
- दिए गये विघुत परिपथ में तथा के मध्य विभवान्तर की गणना कीजिए ।
Text Solution
|