Text Solution
Verified by Experts


Similar Questions
Explore conceptually related problems
Recommended Questions
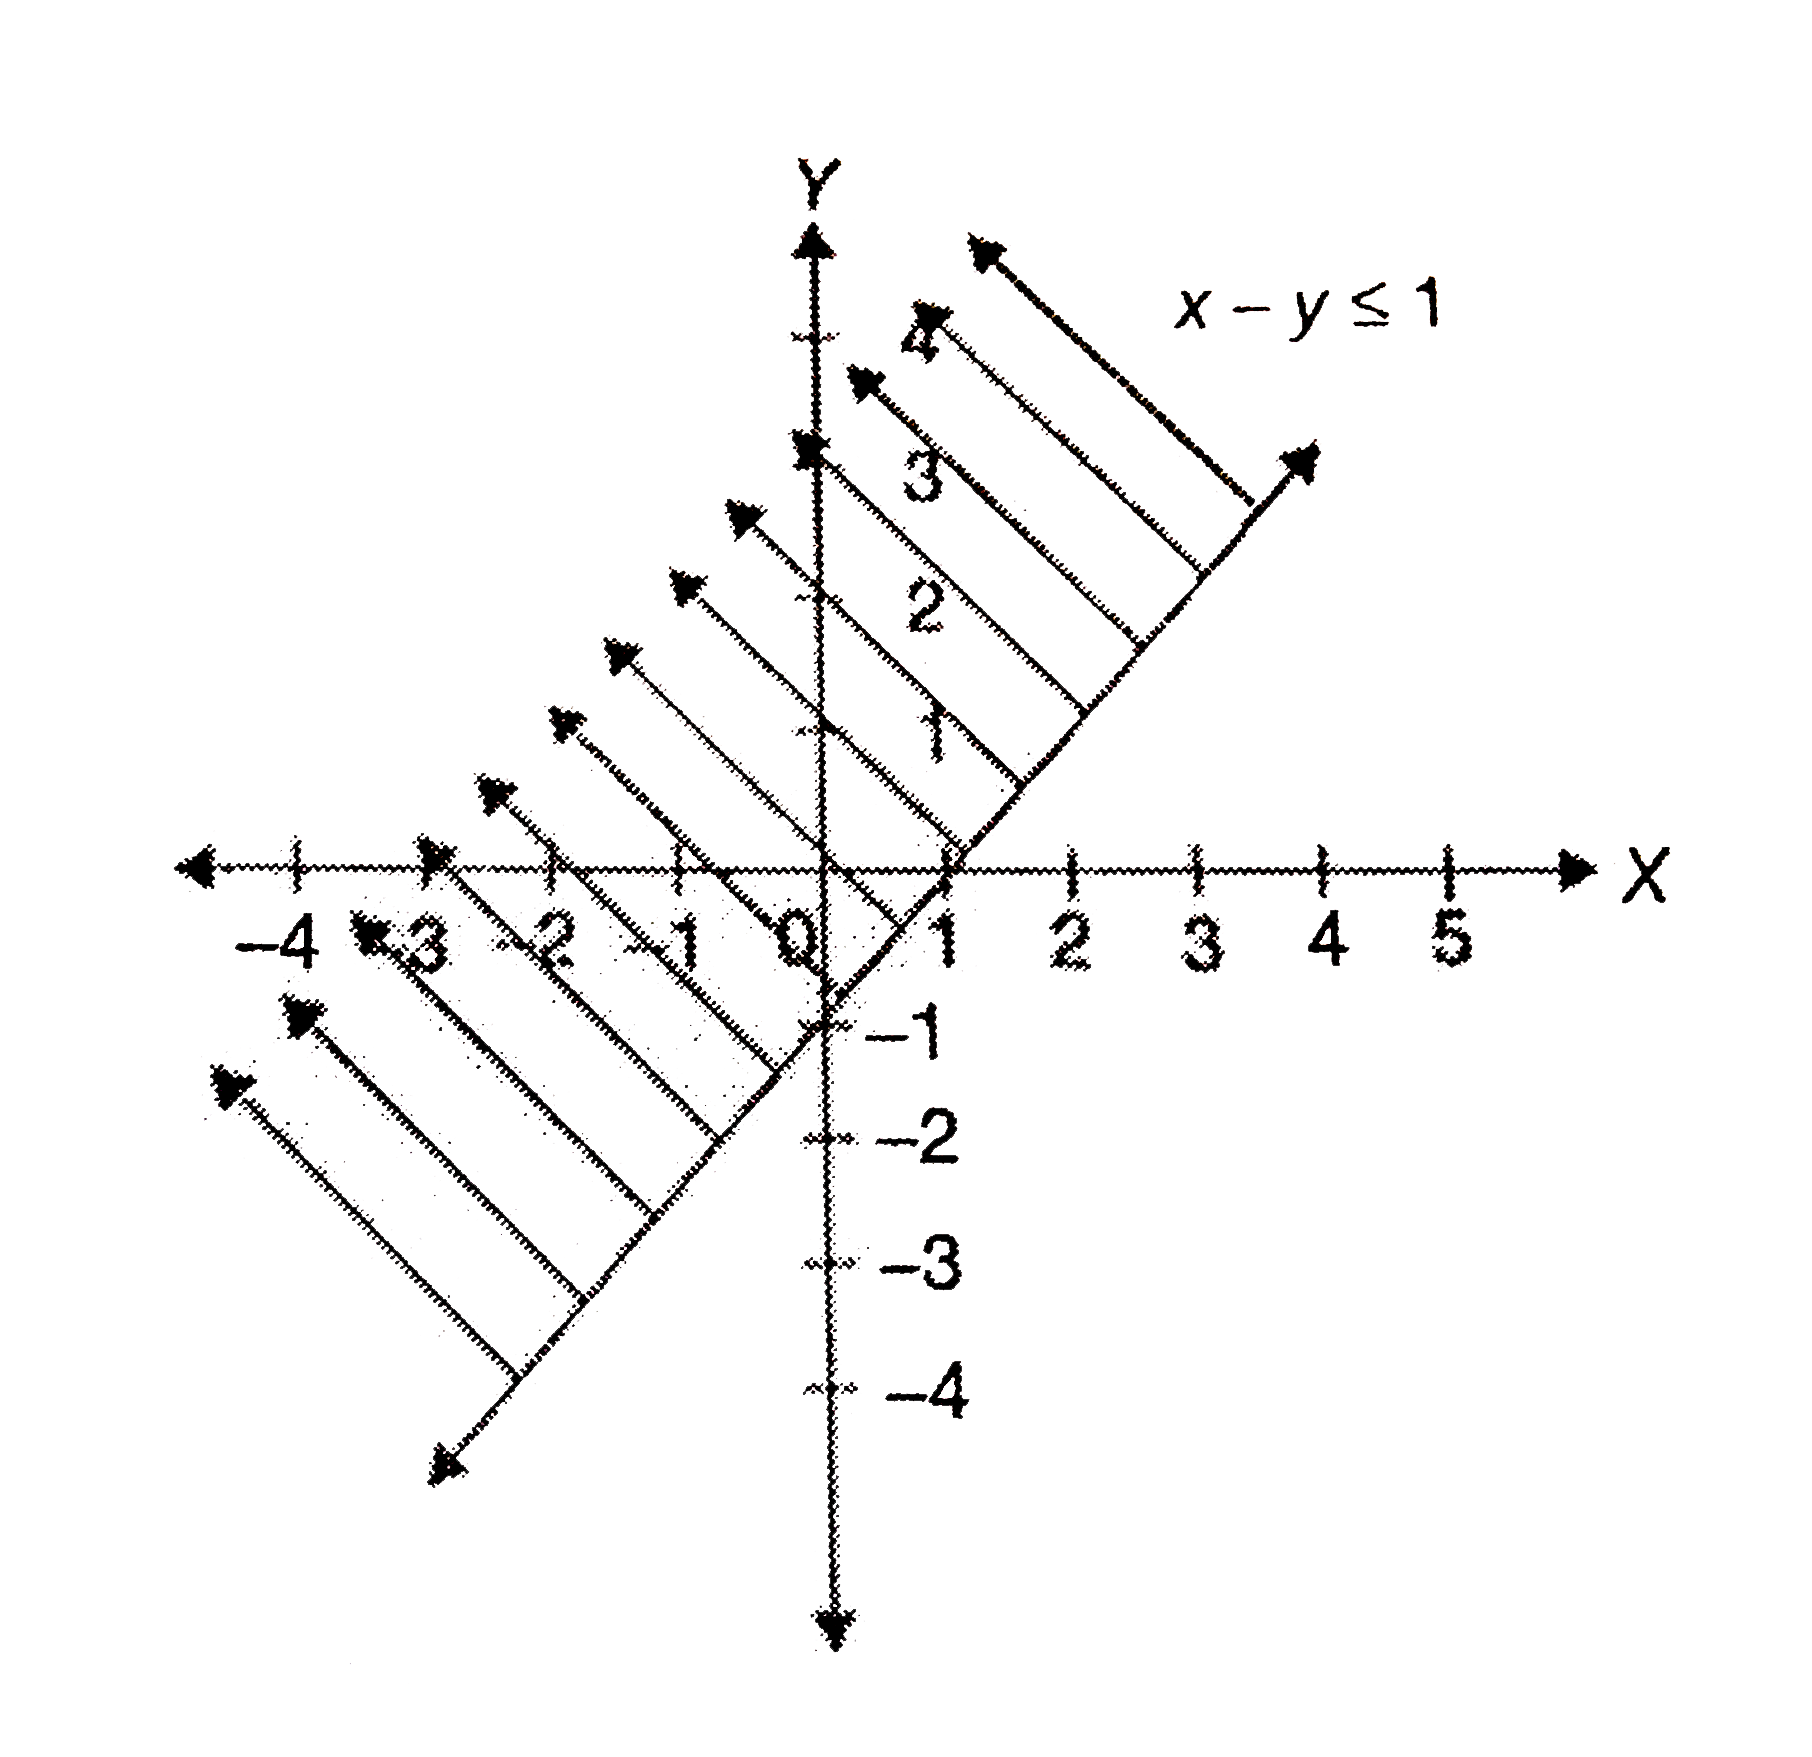
- Draw the graph x -y le 1 in the cartesian plane
Text Solution
|
- Draw the graph x -y is greater than or equal to 0 in the Cartesian pla...
Text Solution
|
- Draw the graph x>=2 in the Cartesian plane.
Text Solution
|
- Draw the graphs y<=-1 and y<=2.5 in the Cartesian plane.sateu
Text Solution
|
- Draw the graphs of linear equations y=x and y=-x on the same cartesian...
Text Solution
|
- Draw the graphs y le -1 and y ge 2.5 in the Cartesian plane.
Text Solution
|
- Draw the graph of x gt -2 in the Cartesian plane.
Text Solution
|
- Draw the graph x-y ge 0 in the Cartesian plane.
Text Solution
|
- Draw the graph x ge 1 in the cartesian plane
Text Solution
|