Text Solution
Verified by Experts


Topper's Solved these Questions
Similar Questions
Explore conceptually related problems
PEARSON IIT JEE FOUNDATION-MOLE CONCEPT, STOICHIOMETRY AND BEHAVIOUR OF GASES -Level 3
- When a fully blown balloon is subjected to sudden bursting. What do yo...
Text Solution
|
- Under what conditions, gases deviate to a large extent from ideal beha...
Text Solution
|
- The vapour pressure of a solution is always less than of the pure solv...
Text Solution
|
- The experimental values of the mass (in grams) of 1 L of CO(2), NH(3)...
Text Solution
|
- In the P vs V graph of CO(2) gas given below, account for the reduct...
Text Solution
|
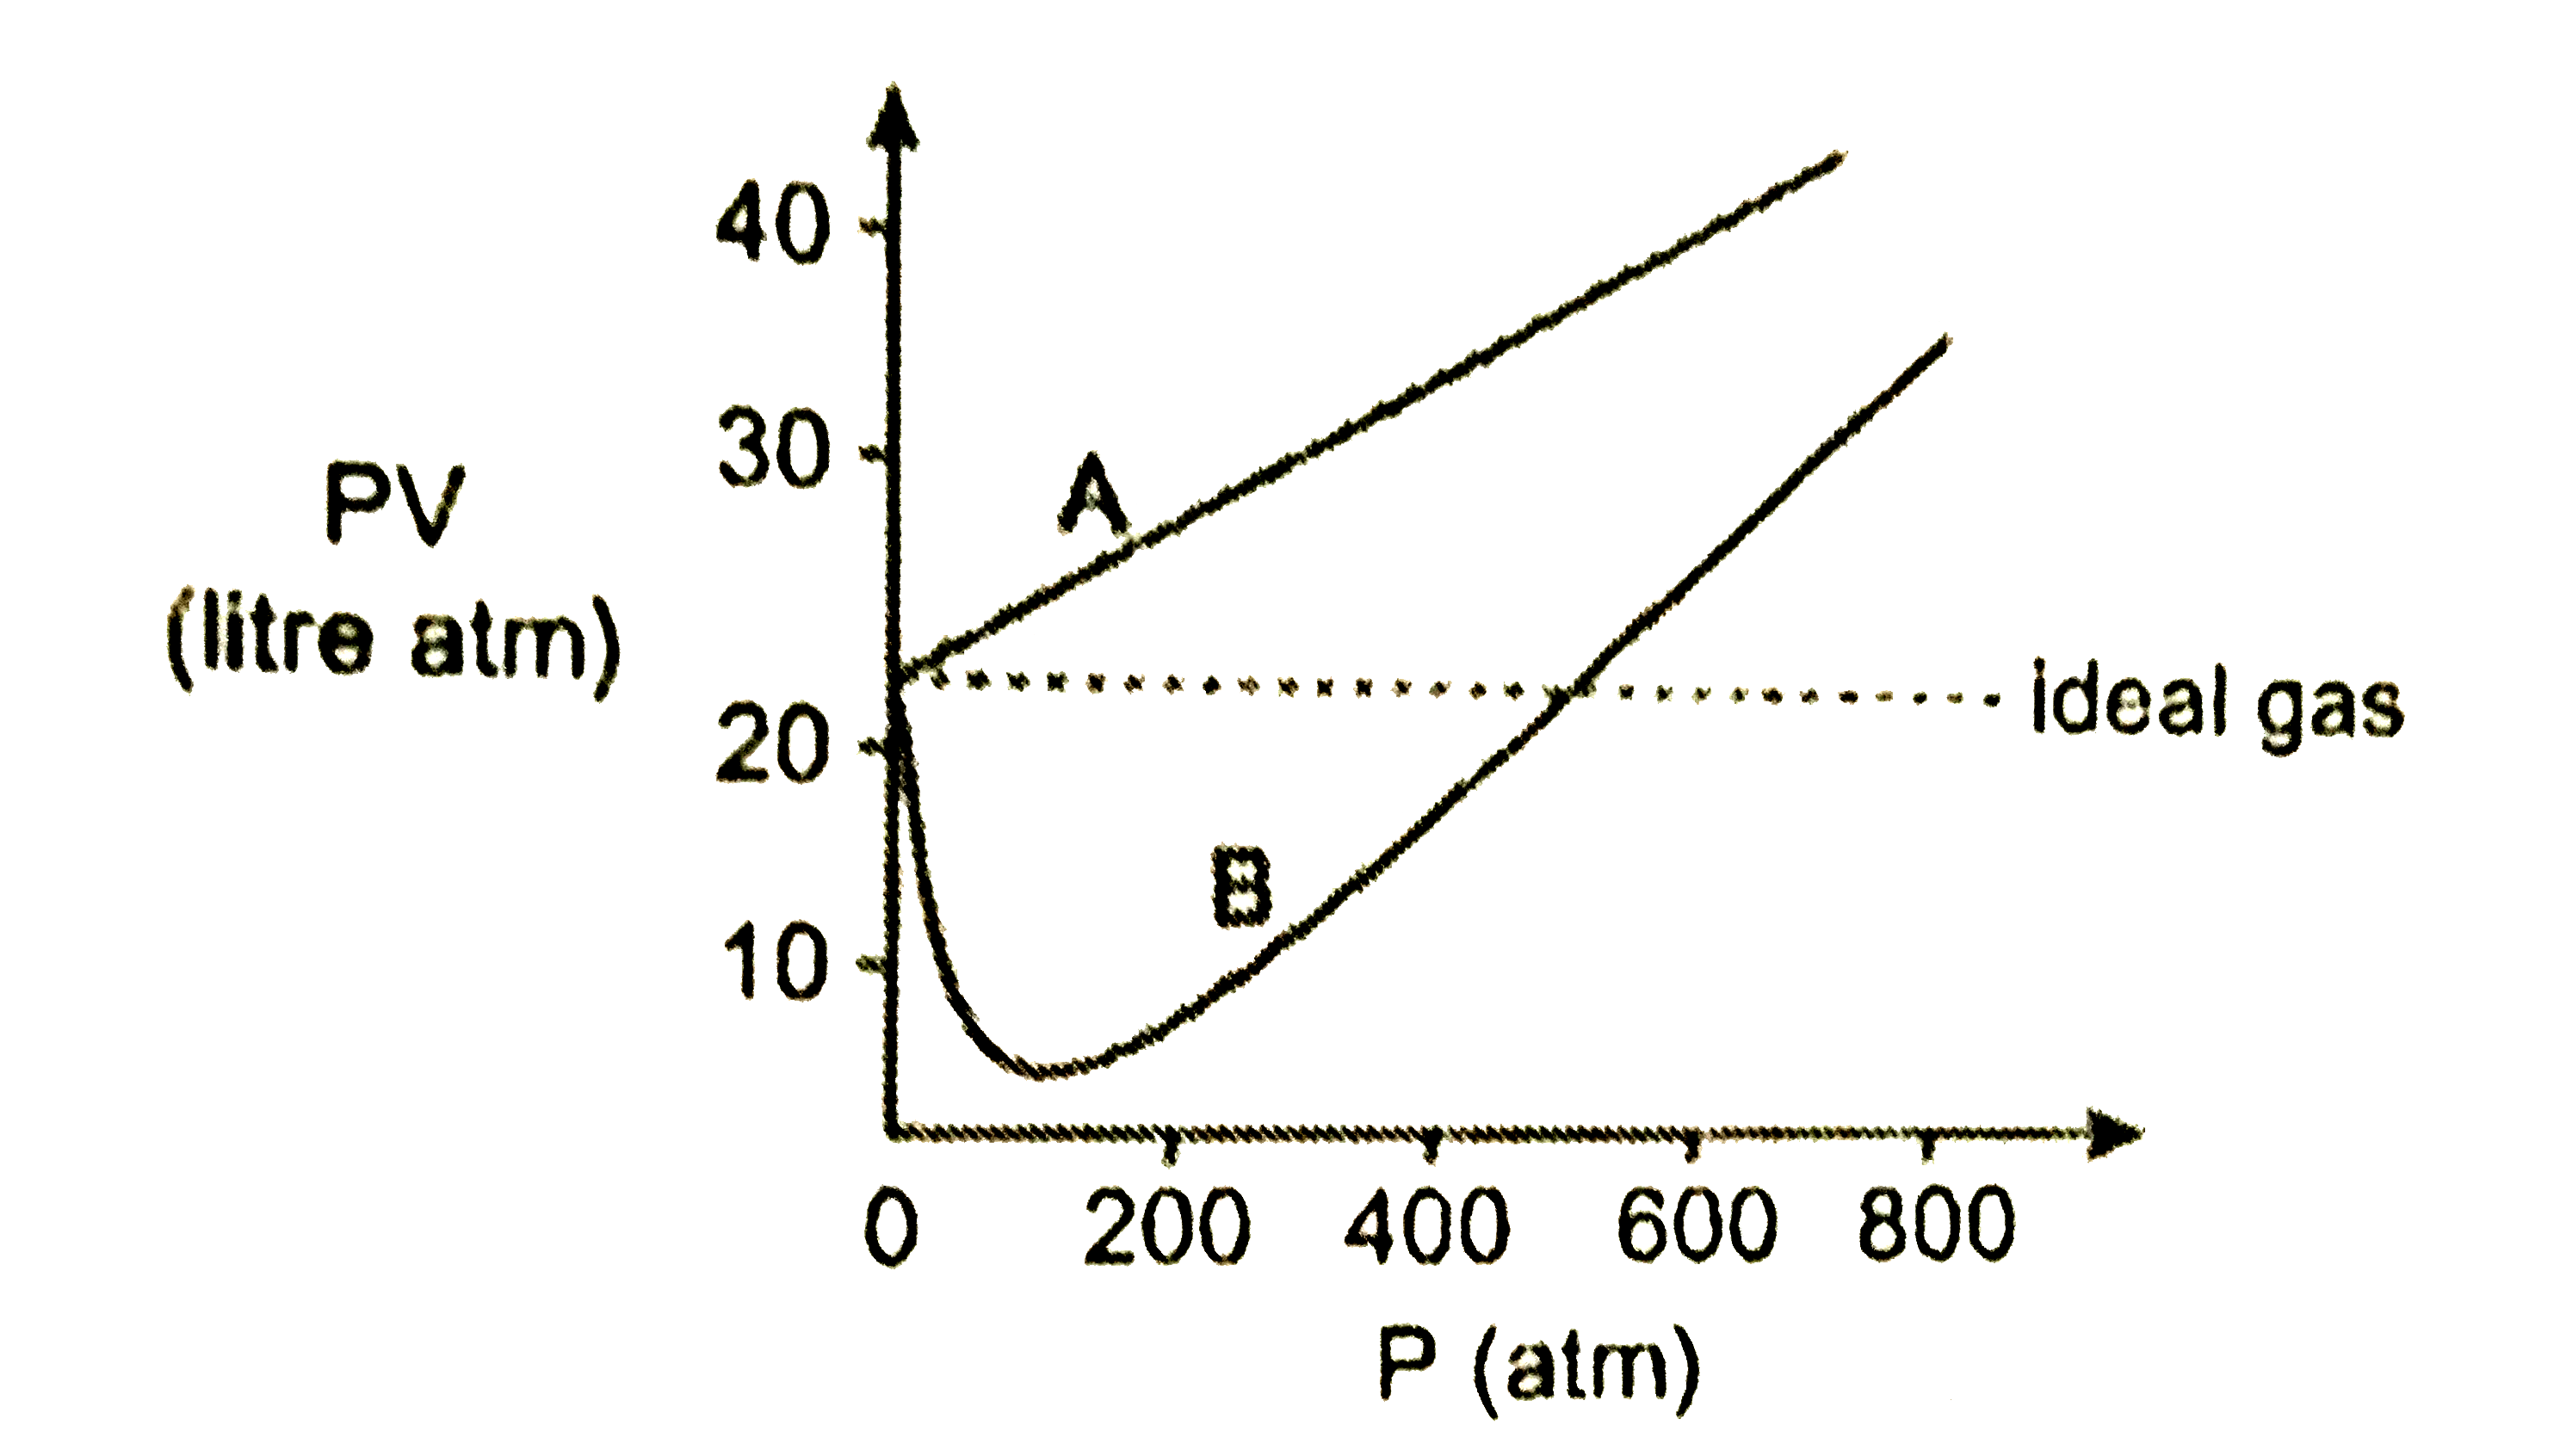
- From the graph given below compare the intermolecular forces of attr...
Text Solution
|
- The various conditions required for the liquefaction of gases A, B, C...
Text Solution
|
- The reduction of acidified solution of ferric ions by hydrogen gas ta...
Text Solution
|
- In the fraph given below, identify the states of solution at the va...
Text Solution
|