


Similar Questions
Explore conceptually related problems
Recommended Questions
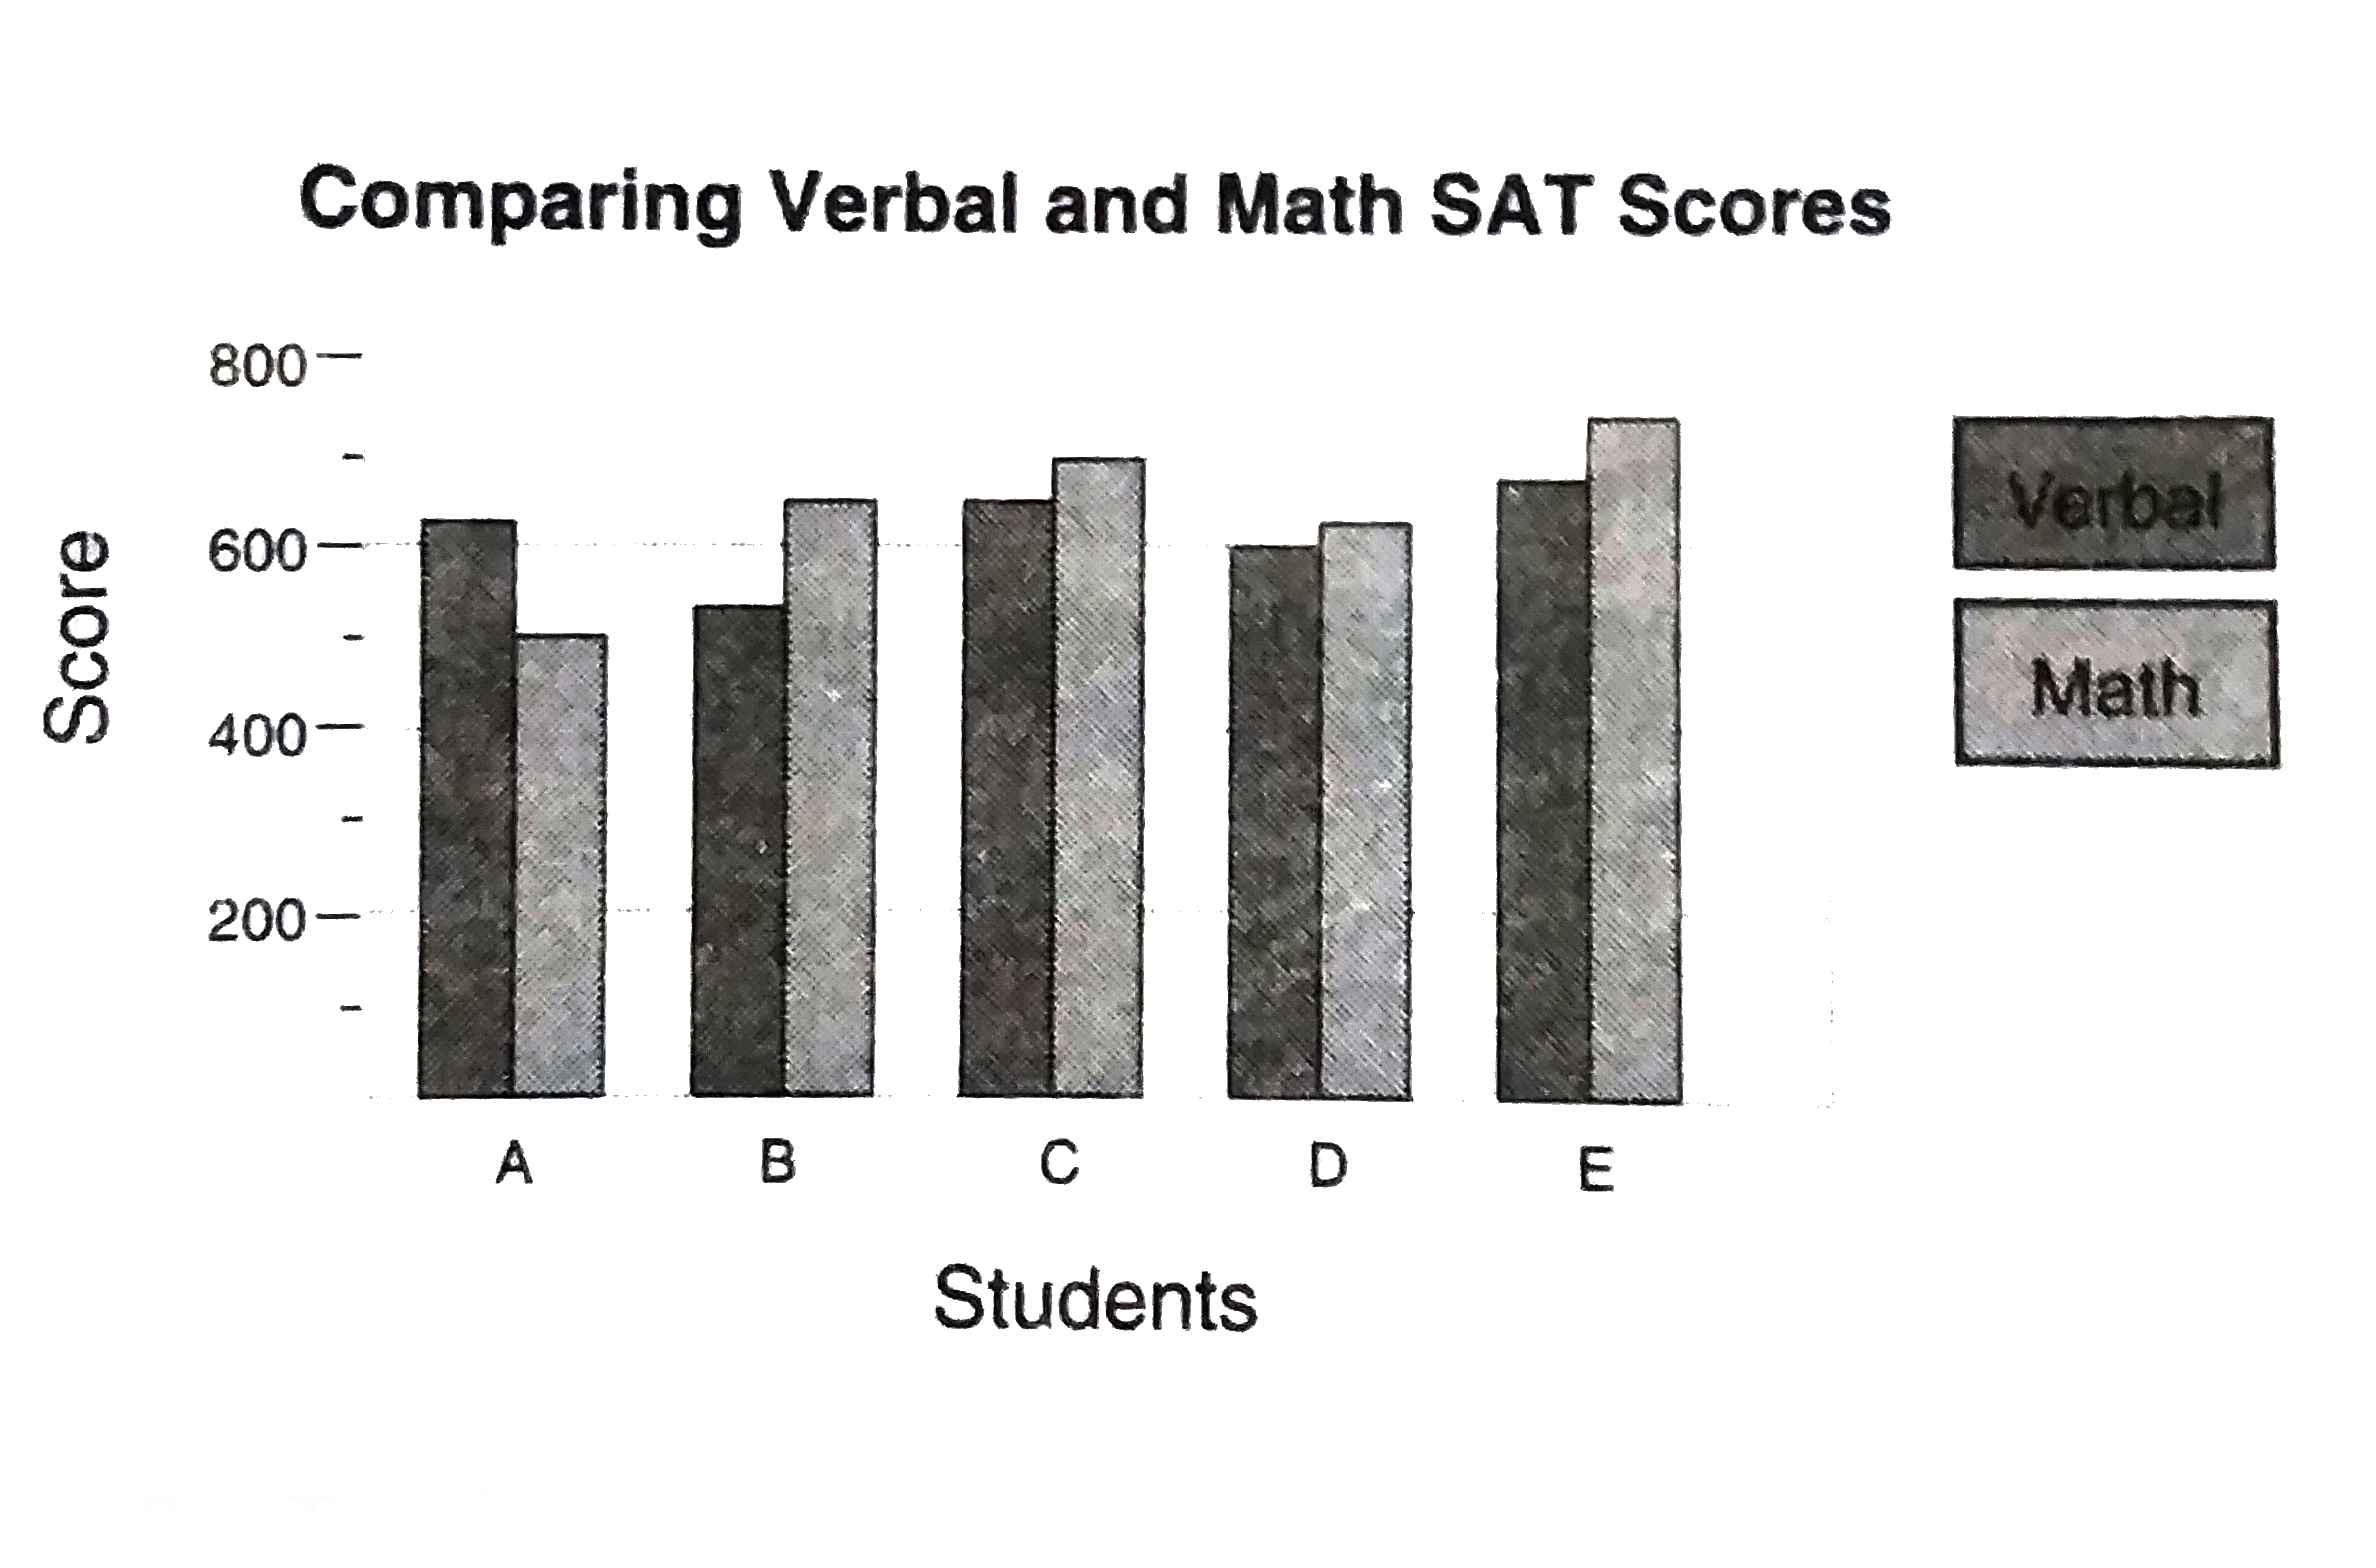
- The bar graph above shows the verbal and math SAT scores for five stud...
Text Solution
|
- How many lines of symmetry does the above figure have ? <img src="http...
Text Solution
|
- Determine the point of symmetry of a regular hexagon. <img src="htt...
Text Solution
|
- Complete adjectant figure so that X-axis and Y-axis are the lines of s...
Text Solution
|
- Dtermine the images of the following figure about the given line : ...
Text Solution
|
- Match the following Column A to Column B
Text Solution
|
- Match the following Column A to Column B
Text Solution
|
- Match the following Column A to Column B
Text Solution
|
- The inequation represented by the graph given below is : <img src="htt...
Text Solution
|