


Similar Questions
Explore conceptually related problems
Recommended Questions
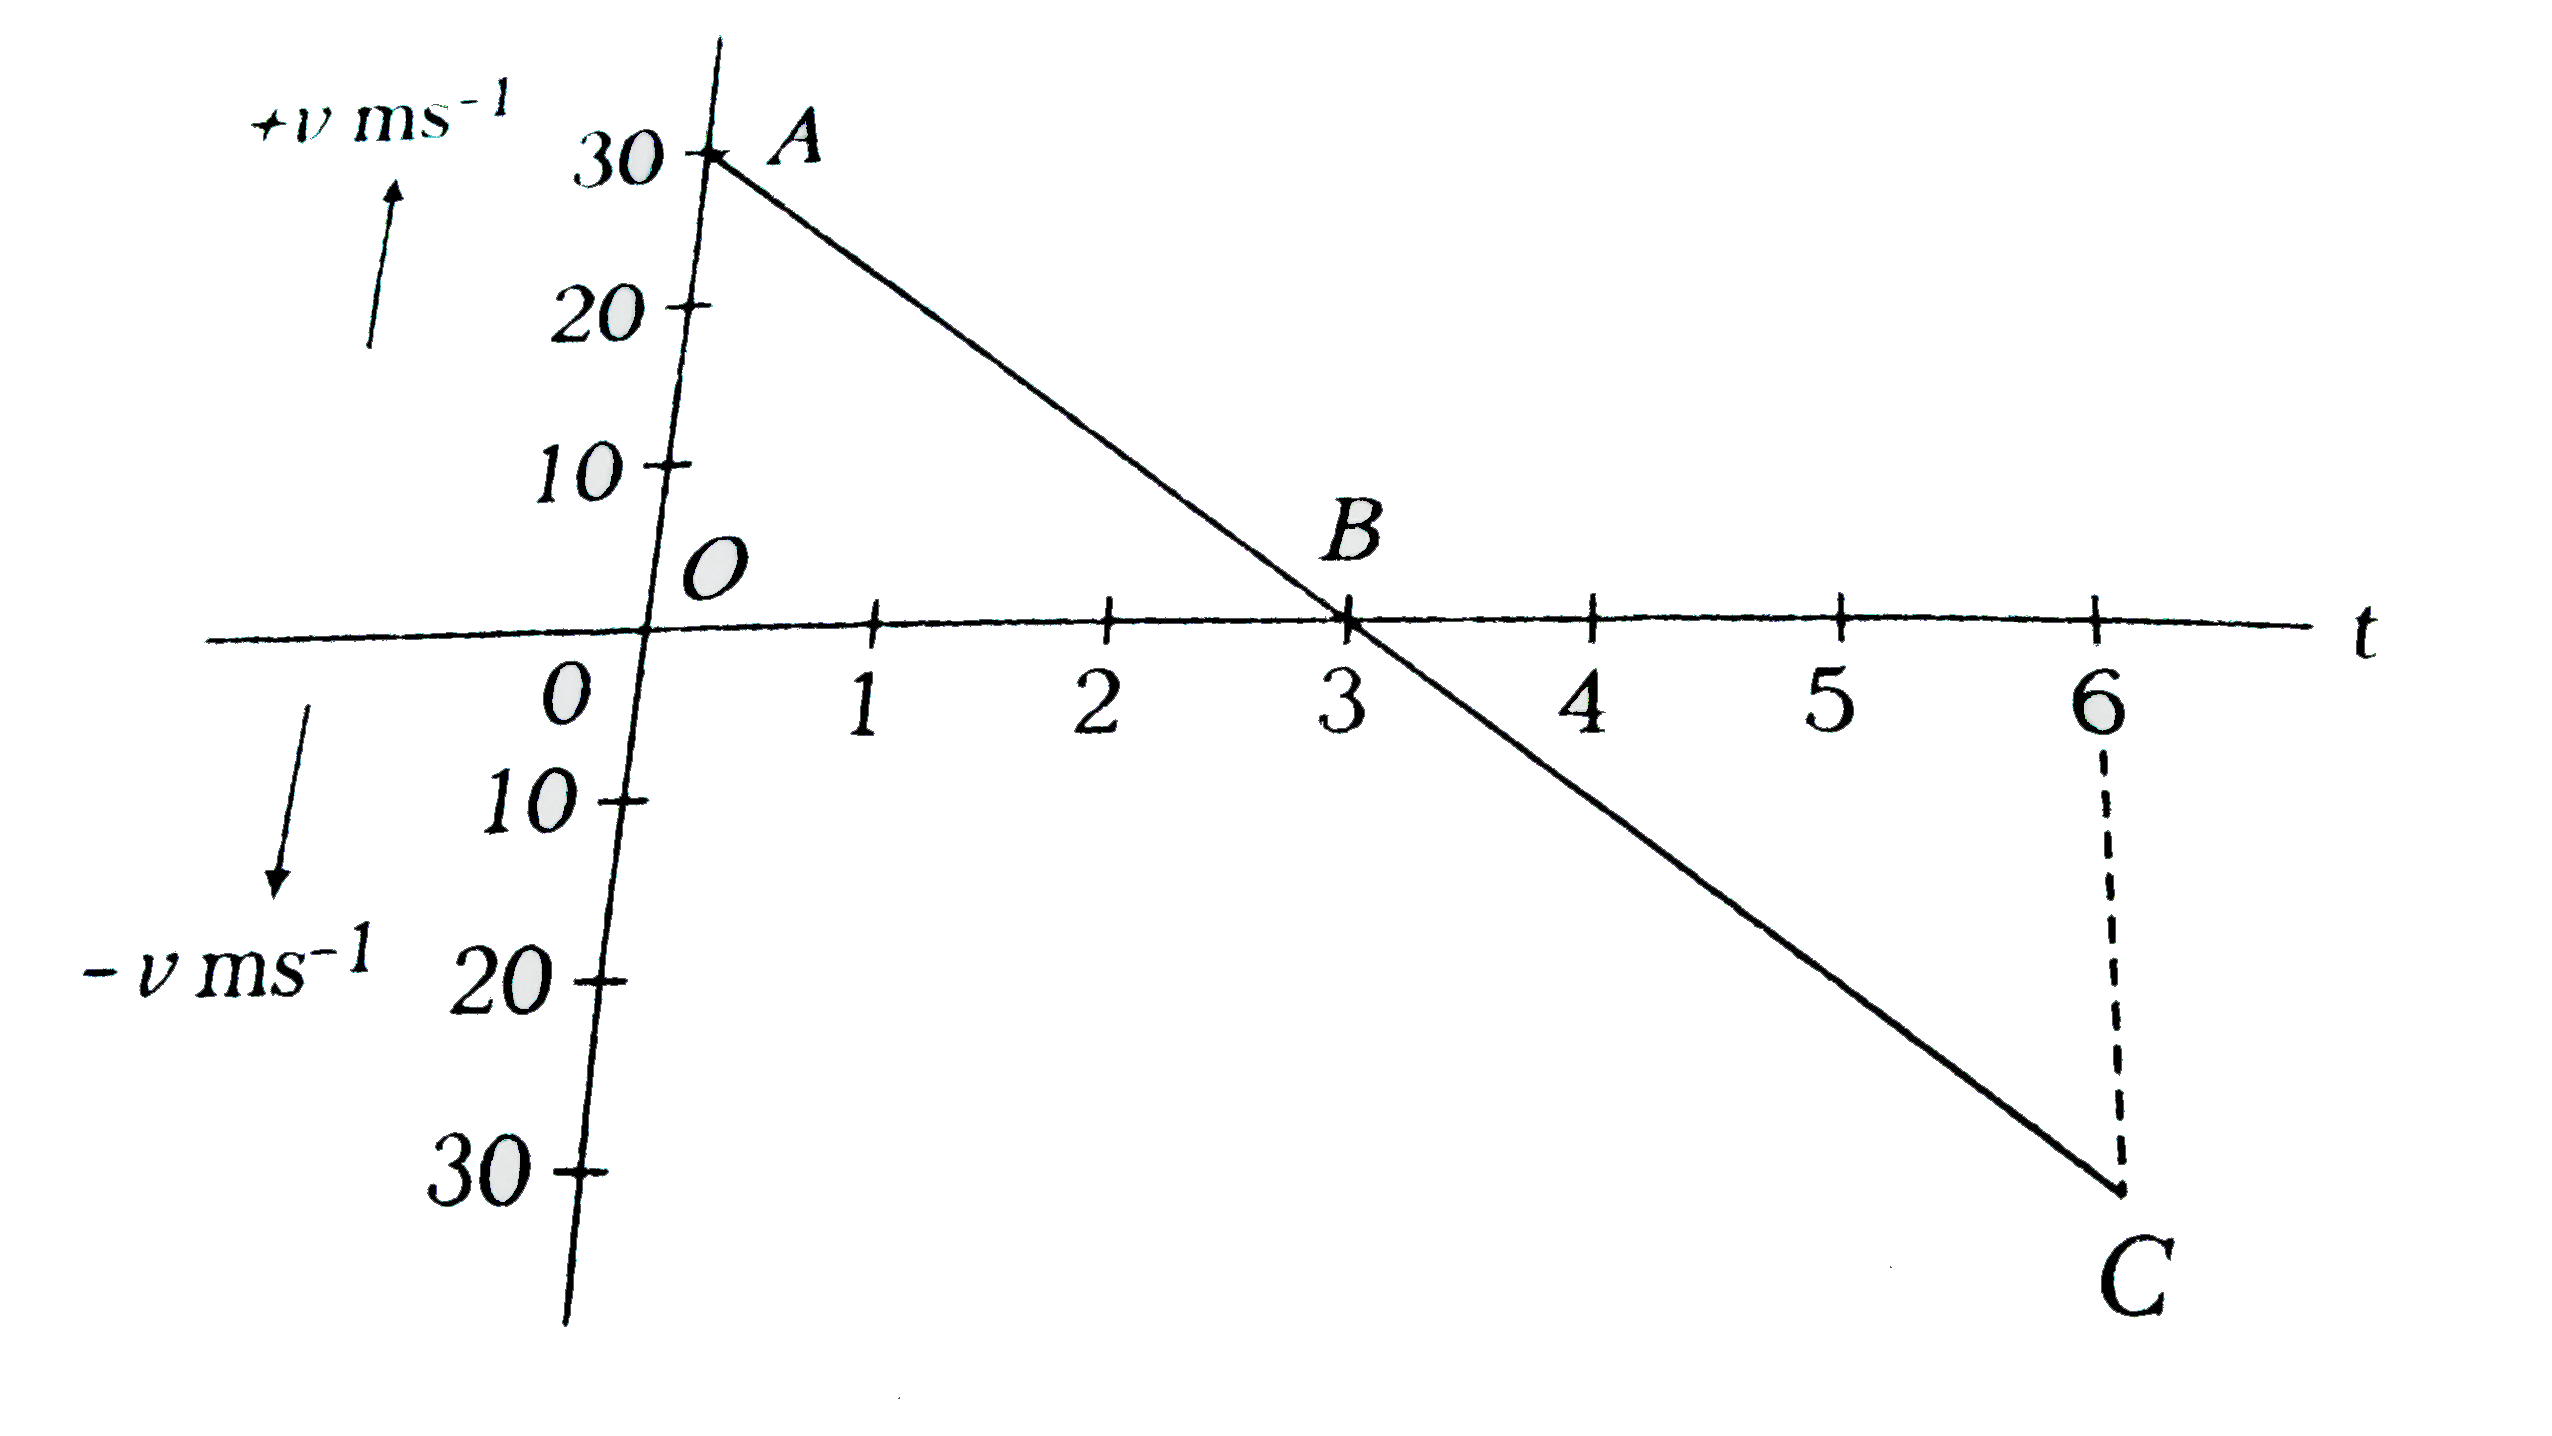
- With the help of the given velocity - time graph, find the (i) displ...
Text Solution
|
- For a given acceleration - time graph, there exist ………………………… velocity...
Text Solution
|
- Draw displacement time and acceleration -time graph for the given velo...
Text Solution
|
- With the help of the given velocity - time graph, find the (i) displ...
Text Solution
|
- चित्र में दर्शाये गये समय-वेग ग्राफ से ज्ञात कीजिए : (i) 0 से 1...
Text Solution
|
- एकसमान गति का अर्थ समझाइए । इसके लिए वेग - समय ग्राफ खींचिए । बताओ कि ...
Text Solution
|
- चित्र 3.41 में किसी पिण्ड का वेग-समय ग्राफ प्रदर्शित है इसकी सहायता से...
Text Solution
|
- " Find corresponding velocity - time graph for given displacement-time...
Text Solution
|
- दिये गये चित्र में एक सीधी रेखा में गति करने वाली वस्तु का समय त्वरण ग...
Text Solution
|