


Topper's Solved these Questions
LINEAR PROGRAMMING
NEW JOYTHI PUBLICATION|Exercise NECERT TEXT BOOK EXERCISE 12.1|10 VideosLINEAR PROGRAMMING
NEW JOYTHI PUBLICATION|Exercise NECERT TEXT BOOK EXERCISE 12.2|10 VideosLINEAR INEQUALITIES
NEW JOYTHI PUBLICATION|Exercise QUESTIONS FROM COMPETITIVE EXAMS|38 VideosMATHEMATICAL REASONING
NEW JOYTHI PUBLICATION|Exercise QUESTION FROM COMPETITIVE EXAMS|23 Videos
Similar Questions
Explore conceptually related problems
NEW JOYTHI PUBLICATION-LINEAR PROGRAMMING -OBJECTIVE TYPE QUESTIONS
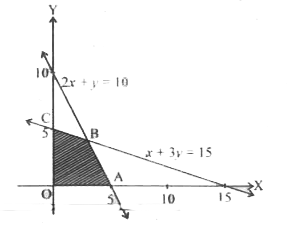
- The graph of a linear programming problem is given below. The shaded r...
Text Solution
|
- The solution set of the inequation 2x+y gt 5 is
Text Solution
|
- Objective function of a L.P.P. is
Text Solution
|
- Which of the terms is not used in a linear programming problem ?
Text Solution
|
- The feasible region for the following constrains L(1) le0, L(2) ge 0, ...
Text Solution
|
- The region respresented by x ge 0, y ge 0 is
Text Solution
|
- The objective function of a L.P.P is
Text Solution
|
- The optimal value of the objective function is attained at the points
Text Solution
|
- Which of the following statements is correct
Text Solution
|
- Feasible region of an L.P.P is shown shaded in the following figure. M...
Text Solution
|
- The feasible region of an L.P.P is shown shaded in the figure. Let Z=3...
Text Solution
|
- The feasbile regin of the LPP is shown shaded in the figure Let Z=3x-4...
Text Solution
|
- Solution set of the inequality x ge 0 is
Text Solution
|