Text Solution
Verified by Experts


Topper's Solved these Questions
ALTERNATING CURRENT
NEW JOYTHI PUBLICATION|Exercise CONTINUOUS EVALUATION (PROJECT)|1 VideosALTERNATING CURRENT
NEW JOYTHI PUBLICATION|Exercise CONTINUOUS EVALUATION ( ASSIGNMENT)|5 VideosALTERNATING CURRENT
NEW JOYTHI PUBLICATION|Exercise PRACTICE PROBLEMS FOR SELF ASSESSMENT|11 VideosATOMS
NEW JOYTHI PUBLICATION|Exercise COMPETITIVE EXAM CORNER|5 Videos
Similar Questions
Explore conceptually related problems
NEW JOYTHI PUBLICATION-ALTERNATING CURRENT -EVALUATION QUESTIONS AND ANSWERS
- What is the average value of emf or current in one cycle?
Text Solution
|
- What is the average value of emf or current in one cycle?
Text Solution
|
- Even though the average current in the circuit is zero, how does an el...
Text Solution
|
- When ac is passing through a resistor, what is the instantaneous power...
Text Solution
|
- For one complete cycle, what is the average power?
Text Solution
|
- What is the maximum ac voltage in our household circuit?
Text Solution
|
- Impendence of a circuit may also be calculated using impendence triang...
Text Solution
|
- The current-frequency response curves are shown in figures above for t...
Text Solution
|
- What is the frequency of direct current?
Text Solution
|
- i= 5 sin 314t. Which is the peak value of current?
Text Solution
|
- Which value of current do you measure with an A.C ammeter?
Text Solution
|
- A capacitor blocks D.C, but allows A.C to pass through it. Explain why...
Text Solution
|
- A transformer cannot work on D.C. Why?
Text Solution
|
- What is the function of a choke coil in a fluorescent tube?
Text Solution
|
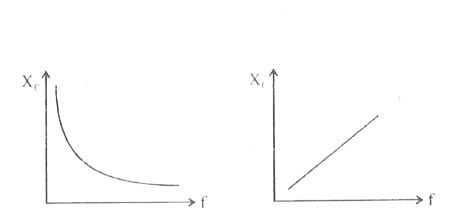
- Draw the graph showing the variation of reactance of (a) C and (b) L w...
Text Solution
|
- Which is more dangerous, A.C or D.C? Why?
Text Solution
|