Text Solution
Verified by Experts


Topper's Solved these Questions
LAW OF MOTION
FULL MARKS|Exercise ADDITIONAL QUESTIONS SOLVED (SHORT ANSWER QUESTIONS (2 MARKS))|12 VideosKINETIC THEORY OF GASES
FULL MARKS|Exercise Addtional Numerical Problems|10 VideosMOTION OF SYSTEM OF PARTICLES AND RIGID BODIES
FULL MARKS|Exercise ADDITIONAL QUESTIONS SOLVED - III (LONG ANSWER QUESTIONS (5 MARKS))|6 Videos
Similar Questions
Explore conceptually related problems
FULL MARKS-LAW OF MOTION -ADDITIONAL QUESTIONS SOLVED (SHORT ANSWER QUESTIONS (3 MARKS & NUMERICALS))
- A block of mass 500 g is at rest on a horizontal table. What steady fo...
Text Solution
|
- A force of 98 N is just required to move a mass of 45 kg on a rough ho...
Text Solution
|
- Calculate the force required to move a train of 2000 quintal up on an ...
Text Solution
|
- A force of 100 N gives a mass m1, an acceleration of 10 ms-2 and of 20...
Text Solution
|
- The pulley arrangement of figure are identical. The mass of the rope i...
Text Solution
|
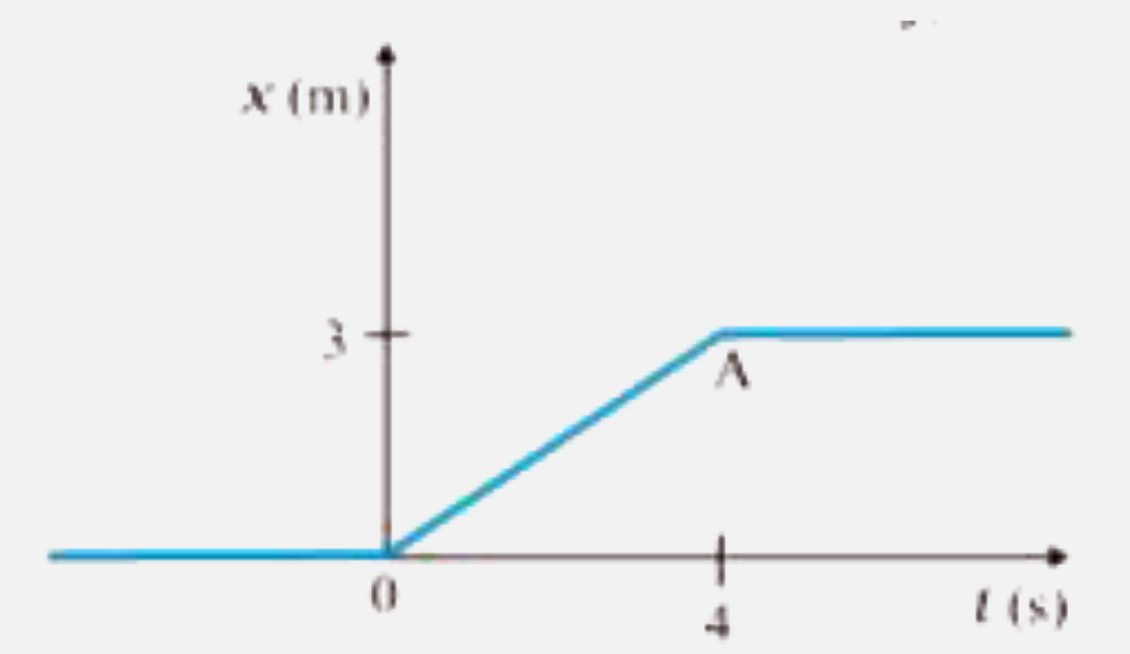
- Figure shows the position-time graph of a particle of mass 4 kg. Wha...
Text Solution
|
- What is the acceleration of the block and trolley system shown in a ...
Text Solution
|
- Solve and fill in the blanks
Text Solution
|
- The rear side of a truck is open and a box of 40 kg mass is placed 5 m...
Text Solution
|
- A block slides down as incline of 30^@ with the horizontal. Starting ...
Text Solution
|
- A helicopter of mass 2000 kg rises with a vertical acceleration of 15 ...
Text Solution
|
- A rectangular box lies on a rough inclined surface. The coefficient of...
Text Solution
|
- Calculate the acceleration of the bicycle of mass 25 kg as
Text Solution
|
- Match the following :
Text Solution
|
- A hunter has a machine gun that can fire 50 g bullets with a velocit...
Text Solution
|
- Two blocks of mass 2 kg and 5 kg are connected by an ideal string pass...
Text Solution
|