


Similar Questions
Explore conceptually related problems
Recommended Questions
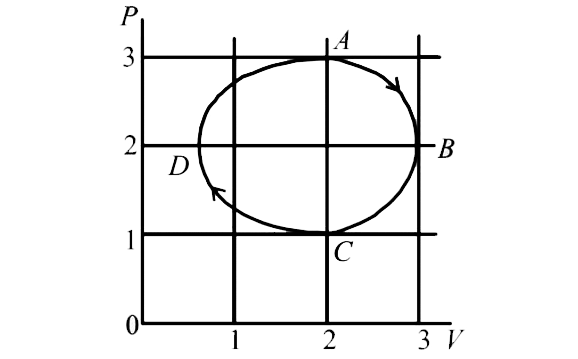
- The figure shows the P-V plot of an ideal gas taken through a cycle AB...
Text Solution
|
- An ideal monatomic gas is taken round the cycle ABCDA as shown in the ...
Text Solution
|
- The figure shows the P-V plot of an ideal gas taken through a cycle AB...
Text Solution
|
- An ideal monoatomic gas is taken the cycle ABCDA as shown in following...
Text Solution
|
- The figure shows the P-V plot of an ideal gas taken through a cycle AB...
Text Solution
|
- An ideal monoatomic gas is taken round the cycle ABCDA as shown in the...
Text Solution
|
- One mole of a monatomic ideal gas is taken through a cycle ABCDA as s...
Text Solution
|
- एक आदर्श एकपरमाणुक गैस को चक्र ABCDA के अनुदिश ले जाया जाता है जैसा कि...
Text Solution
|
- एक आदर्श गैस को चक्र ABCDA से गुजारा जाता है | इसका p - V ग्राफ चित्र ...
Text Solution
|