


Similar Questions
Explore conceptually related problems
Recommended Questions
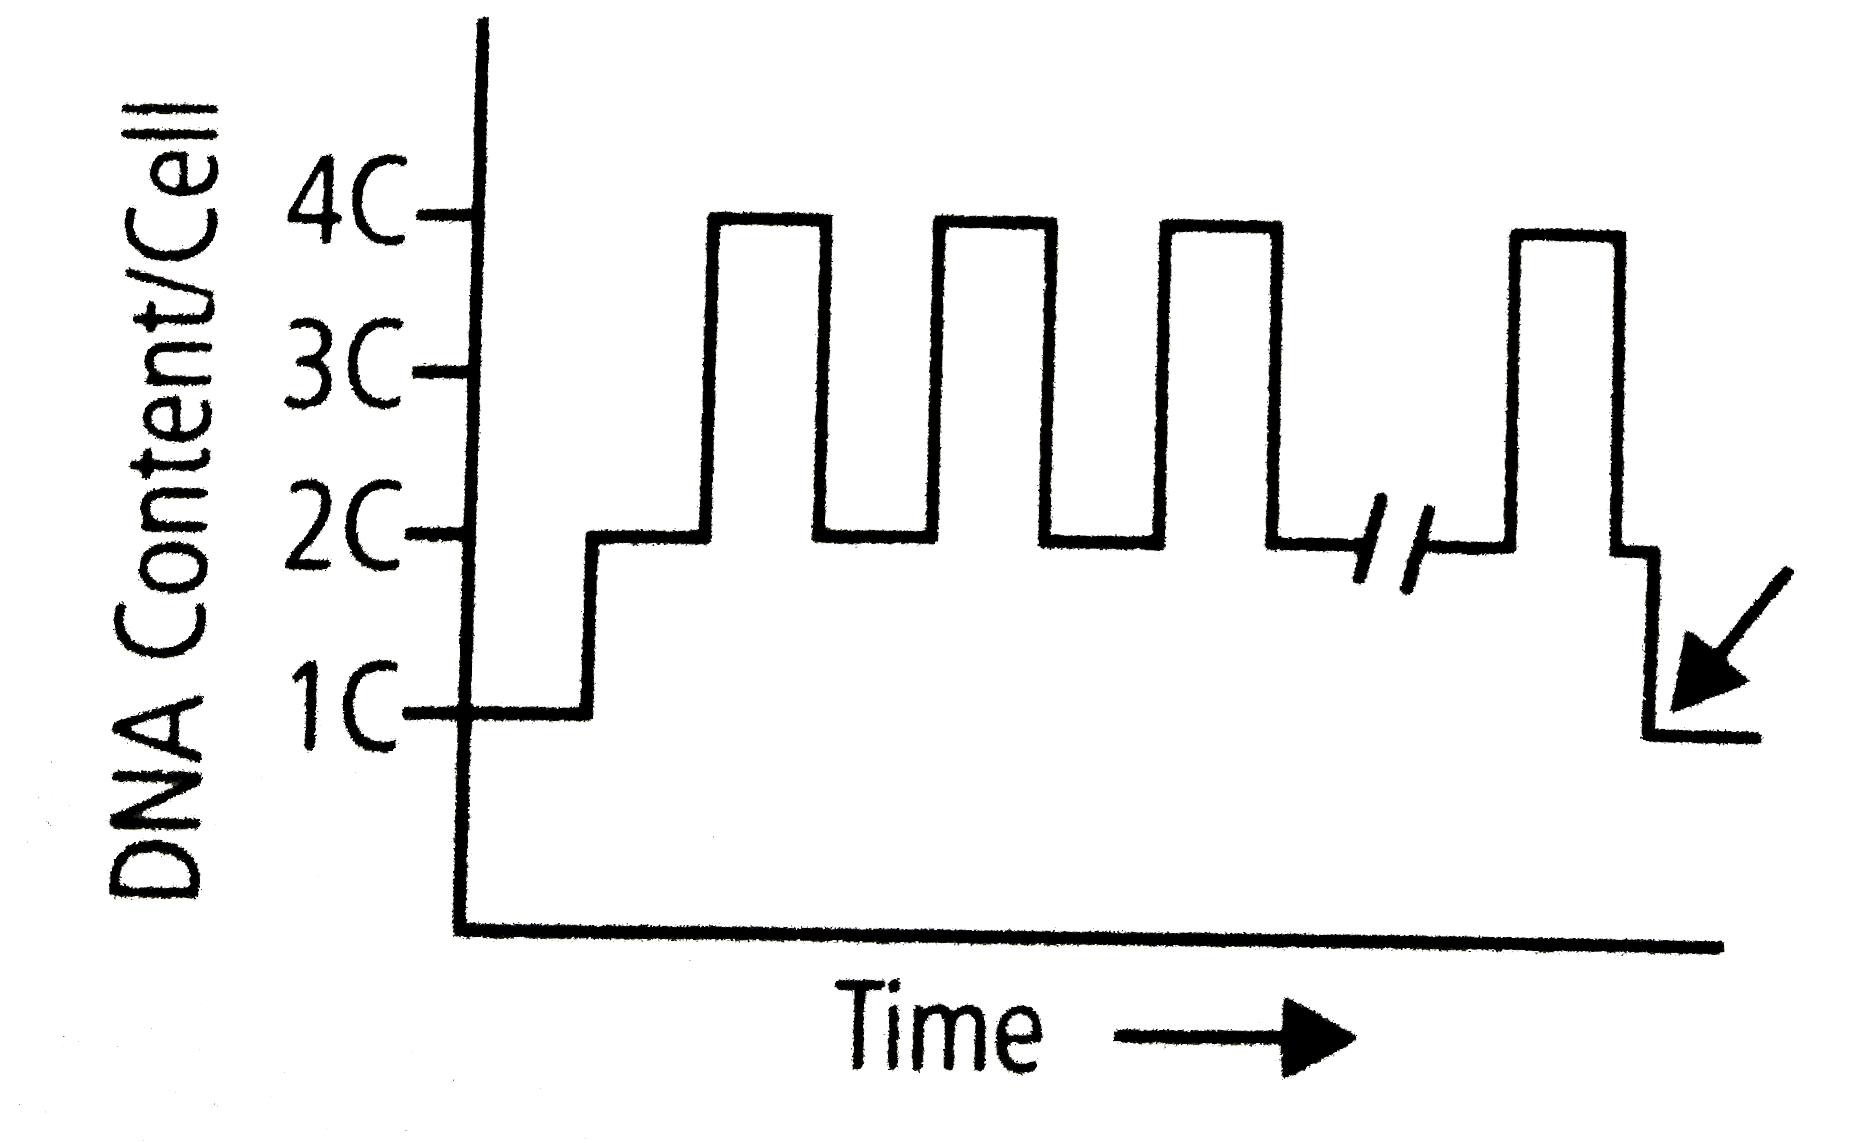
- Given diagram shows variations in the amount of DNA of a developing eu...
Text Solution
|
- Given diagram shows variations in the amount of DNA of a developing eu...
Text Solution
|
- The haploid amount of DNA in a eukaryotic cell is termed :
Text Solution
|
- Observe this floral diagram. What does the part denoted by the arrow i...
Text Solution
|
- Given diagram showing a typical agarose gel electrophoresis showing mi...
Text Solution
|
- The curve showing the variation of pressure with temperature for a giv...
Text Solution
|
- The curve showing the variation of pressure with temperature for a giv...
Text Solution
|
- दिया गया आरेख यूकैरियोट्स में अनुलेखन की प्रक्रिया को दर्शाता है| क्रम...
Text Solution
|
- Given diagram shows variations in the amount of DNA of a developing eu...
Text Solution
|