


Similar Questions
Explore conceptually related problems
Recommended Questions
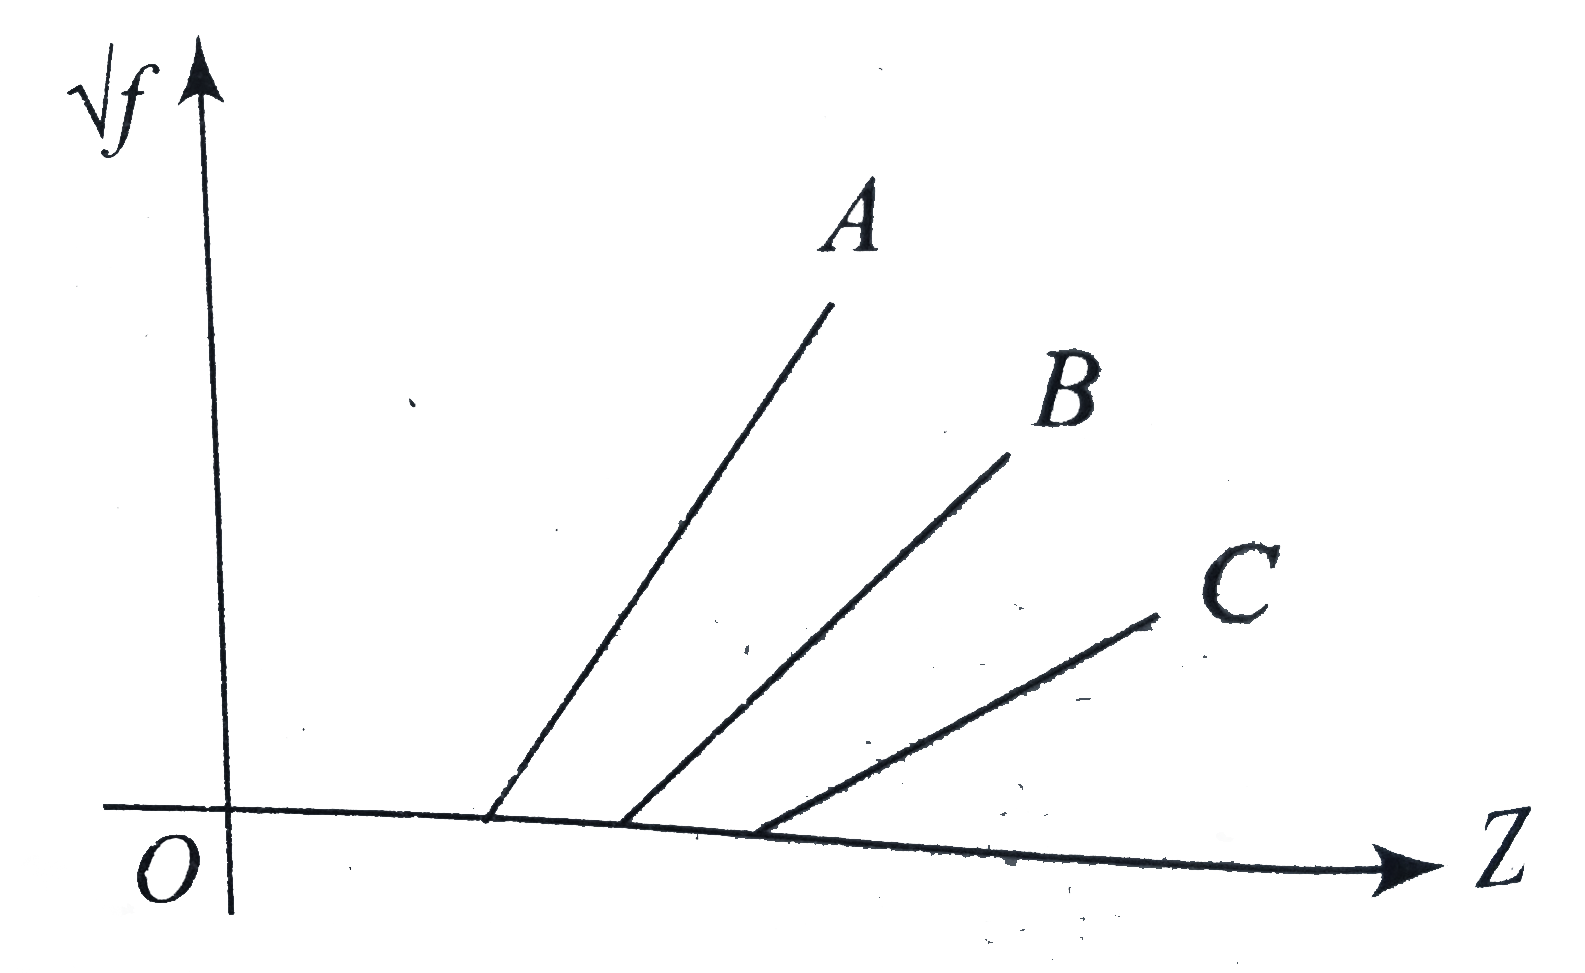
- Figure shown Moseley's plot between sqrt f and Z where f is the freque...
Text Solution
|
- A source of frequency f is moving towards the observer along the line ...
Text Solution
|
- Figure shown Moseley's plot between sqrt f and Z where f is the freque...
Text Solution
|
- In the graph between sqrt(v) and Z for the Mosley's equation sqrt(v) =...
Text Solution
|
- F-x and corresponding U-x graphs are as shown in figure. Three point A...
Text Solution
|
- According to Moseley, a straight line graph is obtained on plotting: ...
Text Solution
|
- F-x and corresponding U-x graph are as shown in figures. Three points ...
Text Solution
|
- At which value of the atomic Z of the target element, does Moseley's...
Text Solution
|
- According to Moseley's law , the frequency (v) of the K(a) line and th...
Text Solution
|