Study the following table and answer the questions
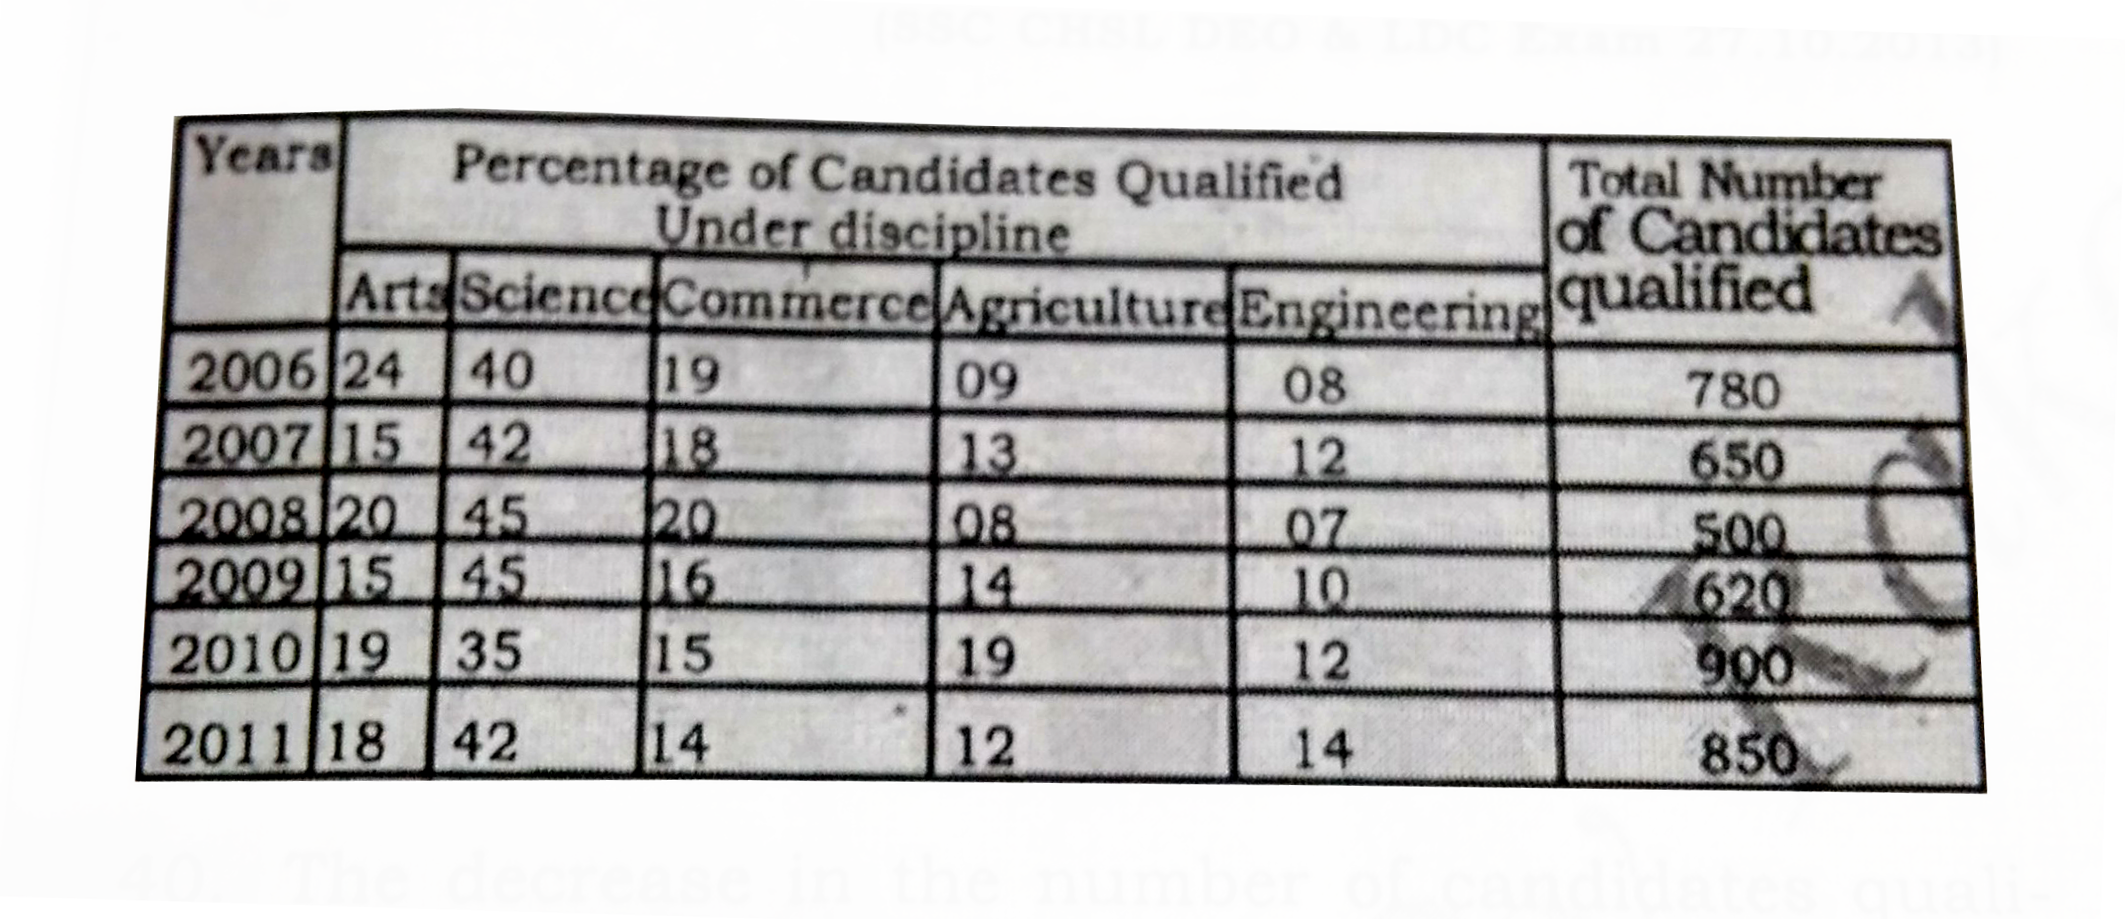
वर्ष 2010 से 2011 तक कला समूह में पास होने वाले छात्रों की संख्या में कितनी कमी आयी ।
Study the following table and answer the questions
वर्ष 2010 से 2011 तक कला समूह में पास होने वाले छात्रों की संख्या में कितनी कमी आयी ।
वर्ष 2010 से 2011 तक कला समूह में पास होने वाले छात्रों की संख्या में कितनी कमी आयी ।


Similar Questions
Explore conceptually related problems
This table shows the percentage of students passing out of five different colleges over three years. It is given that from each college, 200 students appeared every year. यह तालिका तीन वर्षों में पांच अलग-अलग कॉलेजों से पास करने वाले छात्रों का प्रतिशत दर्शाती है | यह दिया गया है कि प्रत्येक कॉलेज से हर वर्ष 200 छात्र शामिल हुए | What is the approximate percentage increase in the number of students passing out of college B in the year 2017 as compared to the previous year? कॉलेज B से वर्ष 2017 में पास करने वाले छात्रों की संख्या में पिछले वर्ष की तुलना में लगभग कितने प्रतिशत की वृद्धि हुई है ?
This table shows the percentage of students passing out of five different colleges over three years. It is given that from each college, 200 students appeared every year. यह तालिका तीन वर्षों में पांच अलग-अलग कॉलेजों से पास करने वाले छात्रों का प्रतिशत दर्शाती है | यह दिया गया है कि प्रत्येक कॉलेज से हर वर्ष 200 छात्र शामिल हुए | What is the ratio of the number of students passing to those failing from college E in the year 2015? वर्ष 2015 में कॉलेज E से पास करने वाले छात्रों की संख्या का फेल करने वाले छात्रों की संख्या के साथ अनुपात ज्ञात करें |
The given Bar Graph presents the results in terms of the number of students in a school for the five academic years, 2013-2014 to 2017-2018. दिया गया दंड आरेख पांच शैक्षणिक वर्षों : 2013-2014 से 2017-2018 तक एक विद्यालय में छात्रों की संख्या के संदर्भ में परिणामों को प्रस्तुत करता है | In which academic year the difference between the number of students passed and that of those failed is the lowest? किस शैक्षणिक वर्ष में, पास करने वाले छात्रों तथा फेल करने वाले छात्रों की संख्या में सबसे कम अंतर है ?
The table below shows the number of students enrolled in five colleges over the five years (2010 to 2014). यह तालिका पांच कॉलेजों में पांच वर्षों ( 2010 से 2014 ) के दौरान नामांकन लेने वाले छात्रों की संख्या दर्शाती है | What is the ratio of the total students enrolled in colleges A and B in the year 2012 to the total students enrolled in colleges D and E in the year 2013? वर्ष 2012 में कॉलेज A और B में नामांकन लेने वाले कुल छात्रों की संख्या का वर्ष 2013 में कॉलेज D और E में नामांकन लेने वाले कुल छात्रों की संख्या के साथ अनुपात ज्ञात करें|
In the following table, the production of various crops (in tonnes) is given from 2015 to 2019. Study the table and answer the question that follows: दी गयी तालिका में, 2015 से 2019 तक विभिन्न फसलों का उत्पादन (टन में ) दिया गया है | इस तालिका का अध्ययन करें तथा फिर पूछे गए प्रश्न का उत्तर दीजिए | The percentage growth of maize in the year 2019 over the year 2015 is: (correct to one decimal place) वर्ष 2019 में वर्ष 2015 की तुलना में मक्का के उत्पादन में कितने प्रतिशत की वृद्धि हुई है ? ( दशमलव के एक स्थान तक )
The given bar graph represents the number of students who appeared in the board examination in session 2017-18 and 2018-19. Study the graph and answer the question that follows. दिया गया दंड आरेख सत्र 2017-18 और 2018-19 सत्र में बोर्ड परीक्षा में उपस्थित होने वाले छात्रों की संख्या को दर्शाता है। आरेख का अध्ययन करें और प्रश्न का उत्तर दें। The difference between the average number of students of Science and Humanities stream in 2017-18 and that in Commerce and Vocational in 2018-19 is: 2017-18 में विज्ञान और मानविकी विषय के छात्रों की औसत संख्या और 2018-19 में वाणिज्य और व्यावसायिक में छात्रों की औसत संख्या के बीच अंतर ज्ञात करे।
In the following table, the production of various crops (in tonnes) is given from 2015 to 2019. Study the table and answer the question that follows: दी गयी तालिका में, 2015 से 2019 तक विभिन्न फसलों का उत्पादन (टन में ) दिया गया है | इस तालिका का अध्ययन करें तथा फिर पूछे गए प्रश्न का उत्तर दीजिए | The highest growth of sugarcane production over its previous year is recorded in the year:/ किस वर्ष गन्ने का उत्पादन पिछले वर्ष की तुलना में अधिकतम रहा है ?
The following figure shows the number of students (in thousands) admitted and passed out per your in a college during years 2000 to 2004, study the figure and answer the questions : : निम्नलिखित आकृति में किसी कॉलेज में वर्ष 2000 से वर्ष 2004 तक प्रति वर्ष भर्ती हुए और उर्तीण हुए छात्रों की संख्या (हजार में) दर्शायी गई है। आकृति का अध्ययन कर प्रश्नों के उत्तर दीजिए : The percent increase in the number of students admitted in the year 2003 over that in 2001 is वर्ष 2001 की तुलना में वर्ष 2003 में भर्ती हुए छात्रों की संख्या में हुई प्रतिशत वृद्धि कितनी है ?
Study the following histogram and answer the given question निम्नलिखित आयत चित्र का अध्ययन करें और दिए गए प्रश्न का उत्तर दें। What is the ratio of the number of students who scored 30 or more marks, but below 40 marks, to the total number of students in the entrance examination ? प्रवेश परीक्षा में 30 या अधिक लेकिन 40 से कम अंक लाने वाले छात्रों की संख्या का प्रवेश परीक्षा में शामिल कुछ छात्रों की संख्या से क्या अनुपात है?
Recommended Questions
- Study the following table and answer the questions वर्ष 2010 से 2...
Text Solution
|
- Match the following lists:
Text Solution
|
- How many lines of symmetry does the above figure have ? <img src="http...
Text Solution
|
- Which of the following are correct chain isomers of butane ? (i) <img ...
Text Solution
|
- Determine the point of symmetry of a regular hexagon. <img src="htt...
Text Solution
|
- Dtermine the images of the following figure about the given line : ...
Text Solution
|
- Match the following Column A to Column B
Text Solution
|
- Match the following Column A to Column B
Text Solution
|
- Match the following Column A to Column B
Text Solution
|