A
B
C
D
Text Solution
Verified by Experts
The correct Answer is:


Topper's Solved these Questions
Similar Questions
Explore conceptually related problems
ARIHANT SSC-BAR CHART-Base Level Questions
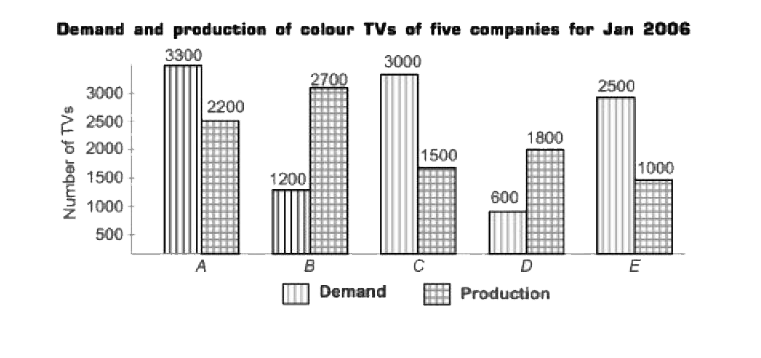
- What is the ratio of the number of companies having more demand than p...
Text Solution
|
- What is the difference between average demand and average production o...
Text Solution
|
- Demand of company D is approximately what percent of demand of company...
Text Solution
|
- What is the ratio of average demand to average production of companies...
Text Solution
|
- The number of student, whose marks lie between 40.5 and 50.5 is
Text Solution
|
- The class, in which the marks of maximum number of students lies, is
Text Solution
|
- The following histogram shows the distribution of marks of 50 students...
Text Solution
|
- A student is marked as 'qualified', if he obtain marks above 40.5. Her...
Text Solution
|
- The following histogram shows the distribution of marks of 50 students...
Text Solution
|
- In which two years, was the value per ton equal?
Text Solution
|
- The year, in which the percentage increase in export was maximum from ...
Text Solution
|
- In which year, was the value per ton minium?
Text Solution
|
- What was the percentage drop in export quantity from 2005 to 2006?
Text Solution
|
- What is the respective ratio of the number of students passed from uni...
Text Solution
|
- What is the difference between the total number of students passed fro...
Text Solution
|
- What is the sum of students passed from university B in the years 2003...
Text Solution
|
- Number of students passed from university B in 2008 is approximately w...
Text Solution
|
- What is the respective ratio of the number of students passed in 2007,...
Text Solution
|
- Which of the following states has twice the percentage of villages ele...
Text Solution
|
- How many State have at least 50% electrified villages?
Text Solution
|