


Similar Questions
Explore conceptually related problems
Recommended Questions
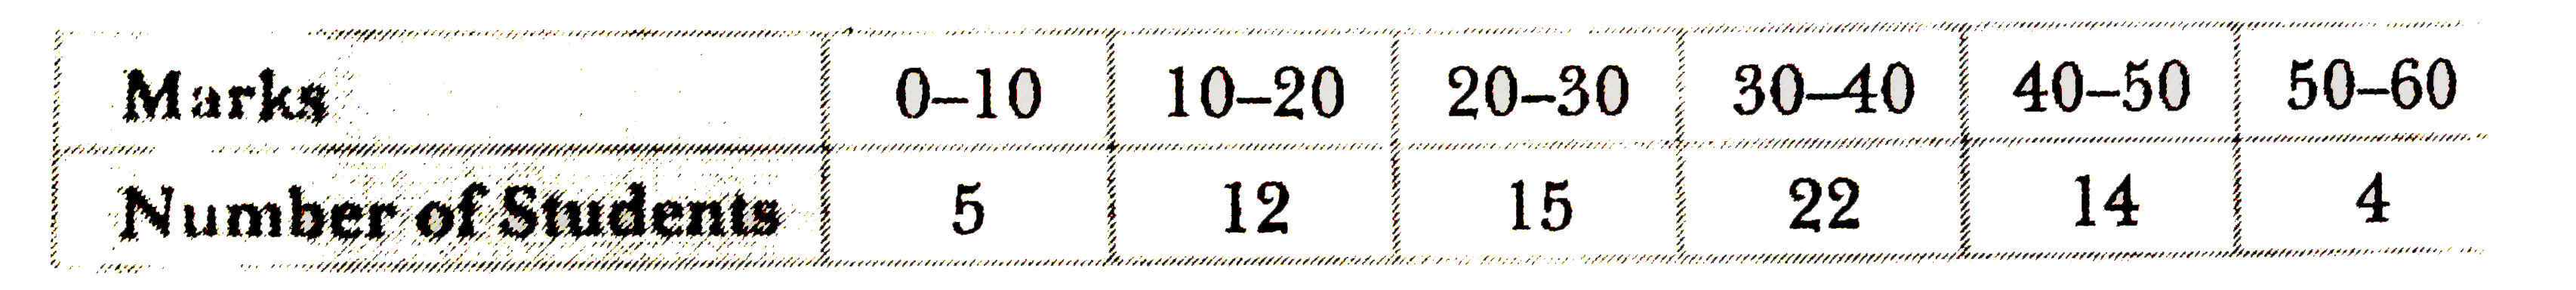
- Draw a histogram, a frequency polygon and frequency curve of the follo...
Text Solution
|
- मिलर के चिंगारी विमुक्ति उपकरण का नामांकित चित्र बनाइए! (वर्णन की आवश्...
Text Solution
|
- कोणीय आवृत्ति omega कि एक प्रत्यावर्ती वोल्टता को प्रतिरोध R , प...
Text Solution
|
- किसी प्रत्यावर्ती परिपथ में L ,C और R श्रेणीक्रम में जुड़े हैं ...
Text Solution
|
- विधुत अनुनाद किसे कहते हैं ? श्रेणी अनुनाद परिपथ कि सहयता से अन...
Text Solution
|
- वाटहीन धारा का एक परिपथ आरेख खीचिए।
Text Solution
|
- अनुनादी आवृत्ति किसे कहते हैं ?
Text Solution
|
- A .C स्त्रोत की आवृत्ति में परिवर्तन के साथ संधारित्र प्रतिघात ...
Text Solution
|
- प्रत्यावर्ती धारा स्त्रोत की आवृत्ति बदलने पर प्रेरण प्रतिघात त...
Text Solution
|