Home
Class 14
MATHS
The following pie chart shows the perfor...

The following pie chart shows the performance in an examination in a particular year for 360 students.The total number of students who have passed in 2nd and 3rd division is

A

162

B

270

C

108

D

None of these

Text Solution

Verified by Experts

The correct Answer is:
B
Promotional Banner

Topper's Solved these Questions

  • PIE CHART

    ARIHANT SSC|Exercise Exercise Higher Skill Level Questions|15 Videos
  • PIE CHART

    ARIHANT SSC|Exercise Exercise Higher Skill Level Questions|15 Videos
  • PERMUTATIONS AND COMBINATIONS

    ARIHANT SSC|Exercise HIGHER SKILL LEVEL QUESTIONS|19 Videos
  • PIPES AND CISTERNS

    ARIHANT SSC|Exercise EXERCISE HIGHER SKILL LEVEL QUESTION|17 Videos

Similar Questions

Explore conceptually related problems

The following pie chart shows the performance in an examination in a particular year for 360 students. The number of students who passed in 1st division is

The following pie chart shows the performance in an examination in a particular year for 360 students. The number of students who passed in 2nd division is more than those in 1st division by

The following pie chart shows the performance in an examination in a particular year for 360 students. The percentage of students who have failed in the examination is

Direction :- The following pie-chart shows the number of students who failed in different subjects in an examination. Examine the chart and answer the following questions. The total number of students who have failed is 500. The number of students failed in Science is less than the number of student failed in all other subects by

The following pie-chart shows the number of students who failed in different subjects in an examination. Examine the chart and answer the following questions. The total number of students who have failed is 500. The number of students failed in science is less than the number of students failed in all other subjects by :

The following pie-chart shows the number of students who failed in different subjects in an examination. Examine the chart and answer the following questions. The total number of students who have failed is 500. The central angle of the sector for the students who have failed in mathematics is :

Study the following table and answer question. Number of students appeared in an examination from five cities : The ratio of the total number of students passed in the examination from cities A and D to that of students failed from cities B and E ?

The following piechart shows the number of students who failed in different subjects in an examination. Examine the chart and answer the questions 5 to the total number of students who have failed is 500. Number of students who failed in Mathema tics is less than the students who did not qualify in language is -

The following piechart shows the number of students who failed in different subjects in an examination. Examine the chart and answer the questions 5 to the total number of students who have failed is 500. Total number of students who did not qualify in Mathematics or Language or Science, is

ARIHANT SSC-PIE CHART -Exercise Base Level Questions
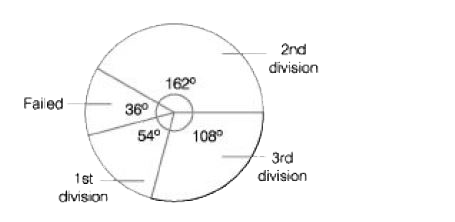
  1. The ratio of successful students to the failed students is

    Text Solution

    |

  2. The following pie chart shows the performance in an examination in a p...

    Text Solution

    |

  3. The following pie chart shows the performance in an examination in a p...

    Text Solution

    |

  4. the following examination shows the analysis of the result of an exami...

    Text Solution

    |

  5. The following examination shows the analysis of the result of an exami...

    Text Solution

    |

  6. The following examination shows the analysis of the result of an exami...

    Text Solution

    |

  7. The following examination shows the analysis of the result of an exami...

    Text Solution

    |

  8. The following examination shows the analysis of the result of an exami...

    Text Solution

    |

  9. If the cost of paper is rs 150000, then the expense on advertisement i...

    Text Solution

    |

  10. The central angle corresponding tothecost ofprinting is

    Text Solution

    |

  11. The following pie chart represents a total expenditure of 540000 on di...

    Text Solution

    |

  12. The following pie chart represents a total expenditure of 540000 on di...

    Text Solution

    |

  13. The following pie chart represents a total expenditure of 540000 on di...

    Text Solution

    |

  14. The following pie chart represents a total expenditure of 540000 on di...

    Text Solution

    |

  15. The following pie chart represents a total expenditure of 540000 on di...

    Text Solution

    |

  16. If two-ninth of the teachers who teach Physics, are female, then numbe...

    Text Solution

    |

  17. What is the total number of teachers teaching Chemistry, English and B...

    Text Solution

    |

  18. What is the difference between the total number of teachers who teach ...

    Text Solution

    |

  19. What is the respective ratio of the number of teachers who teach Mathe...

    Text Solution

    |

  20. If the percentage of Mathematics teachers isincreased by50%andpercenta...

    Text Solution

    |