


Similar Questions
Explore conceptually related problems
Recommended Questions
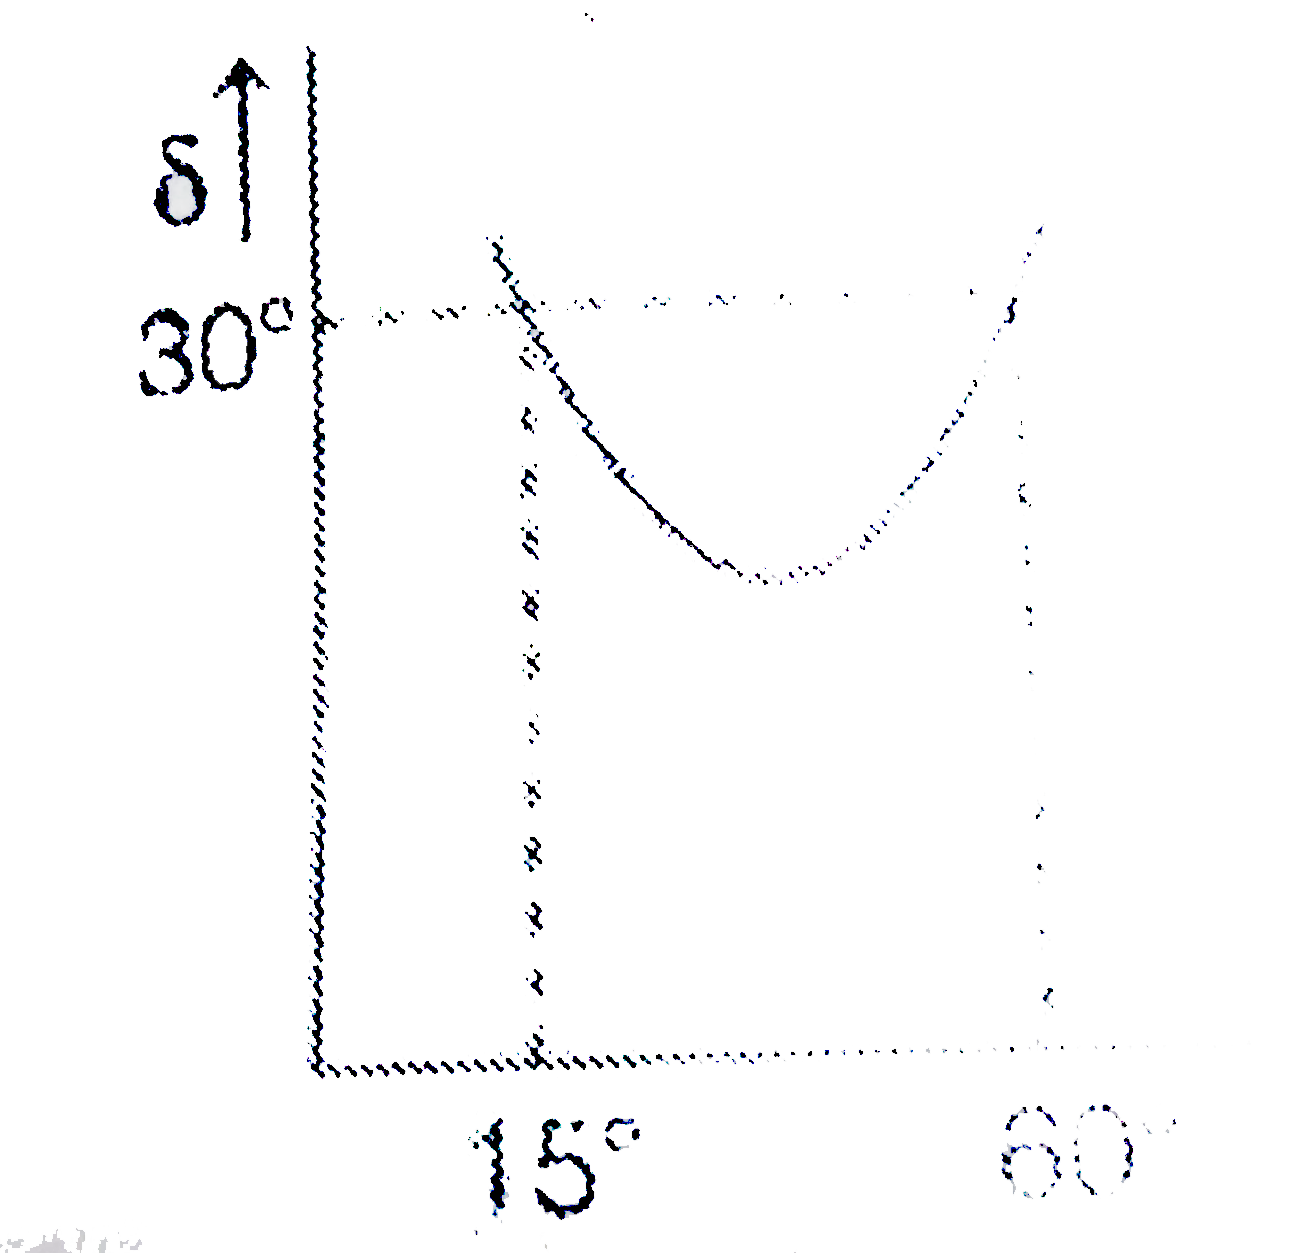
- Figure shows graph of deviation delta versus angle of incidence for a ...
Text Solution
|
- Figure shows the graph of angle of deviation del versus angle of incid...
Text Solution
|
- The angle of a prism is 60^(@) When light is incident at an angle of 6...
Text Solution
|
- The angle of a prism is 60^(@) . When light is incident at an angle of...
Text Solution
|
- Figure shown the graph of angle of deviation delta verses angle of inc...
Text Solution
|
- Figure shows graph of deviation delta versus angle of incidence for a ...
Text Solution
|
- एक त्रिभुजाकार प्रिज्म के लिये विचलन कोण (delta) तथा आपतन कोण (i) में ...
Text Solution
|
- विचलन कोण का आपतन कोण के संगत ग्राफ किसी समबाहु त्रिभुज प्रिज्म के लि...
Text Solution
|
- A ray of light is incident on one face of a prism at an angle of 50^(@...
Text Solution
|