


Similar Questions
Explore conceptually related problems
Recommended Questions
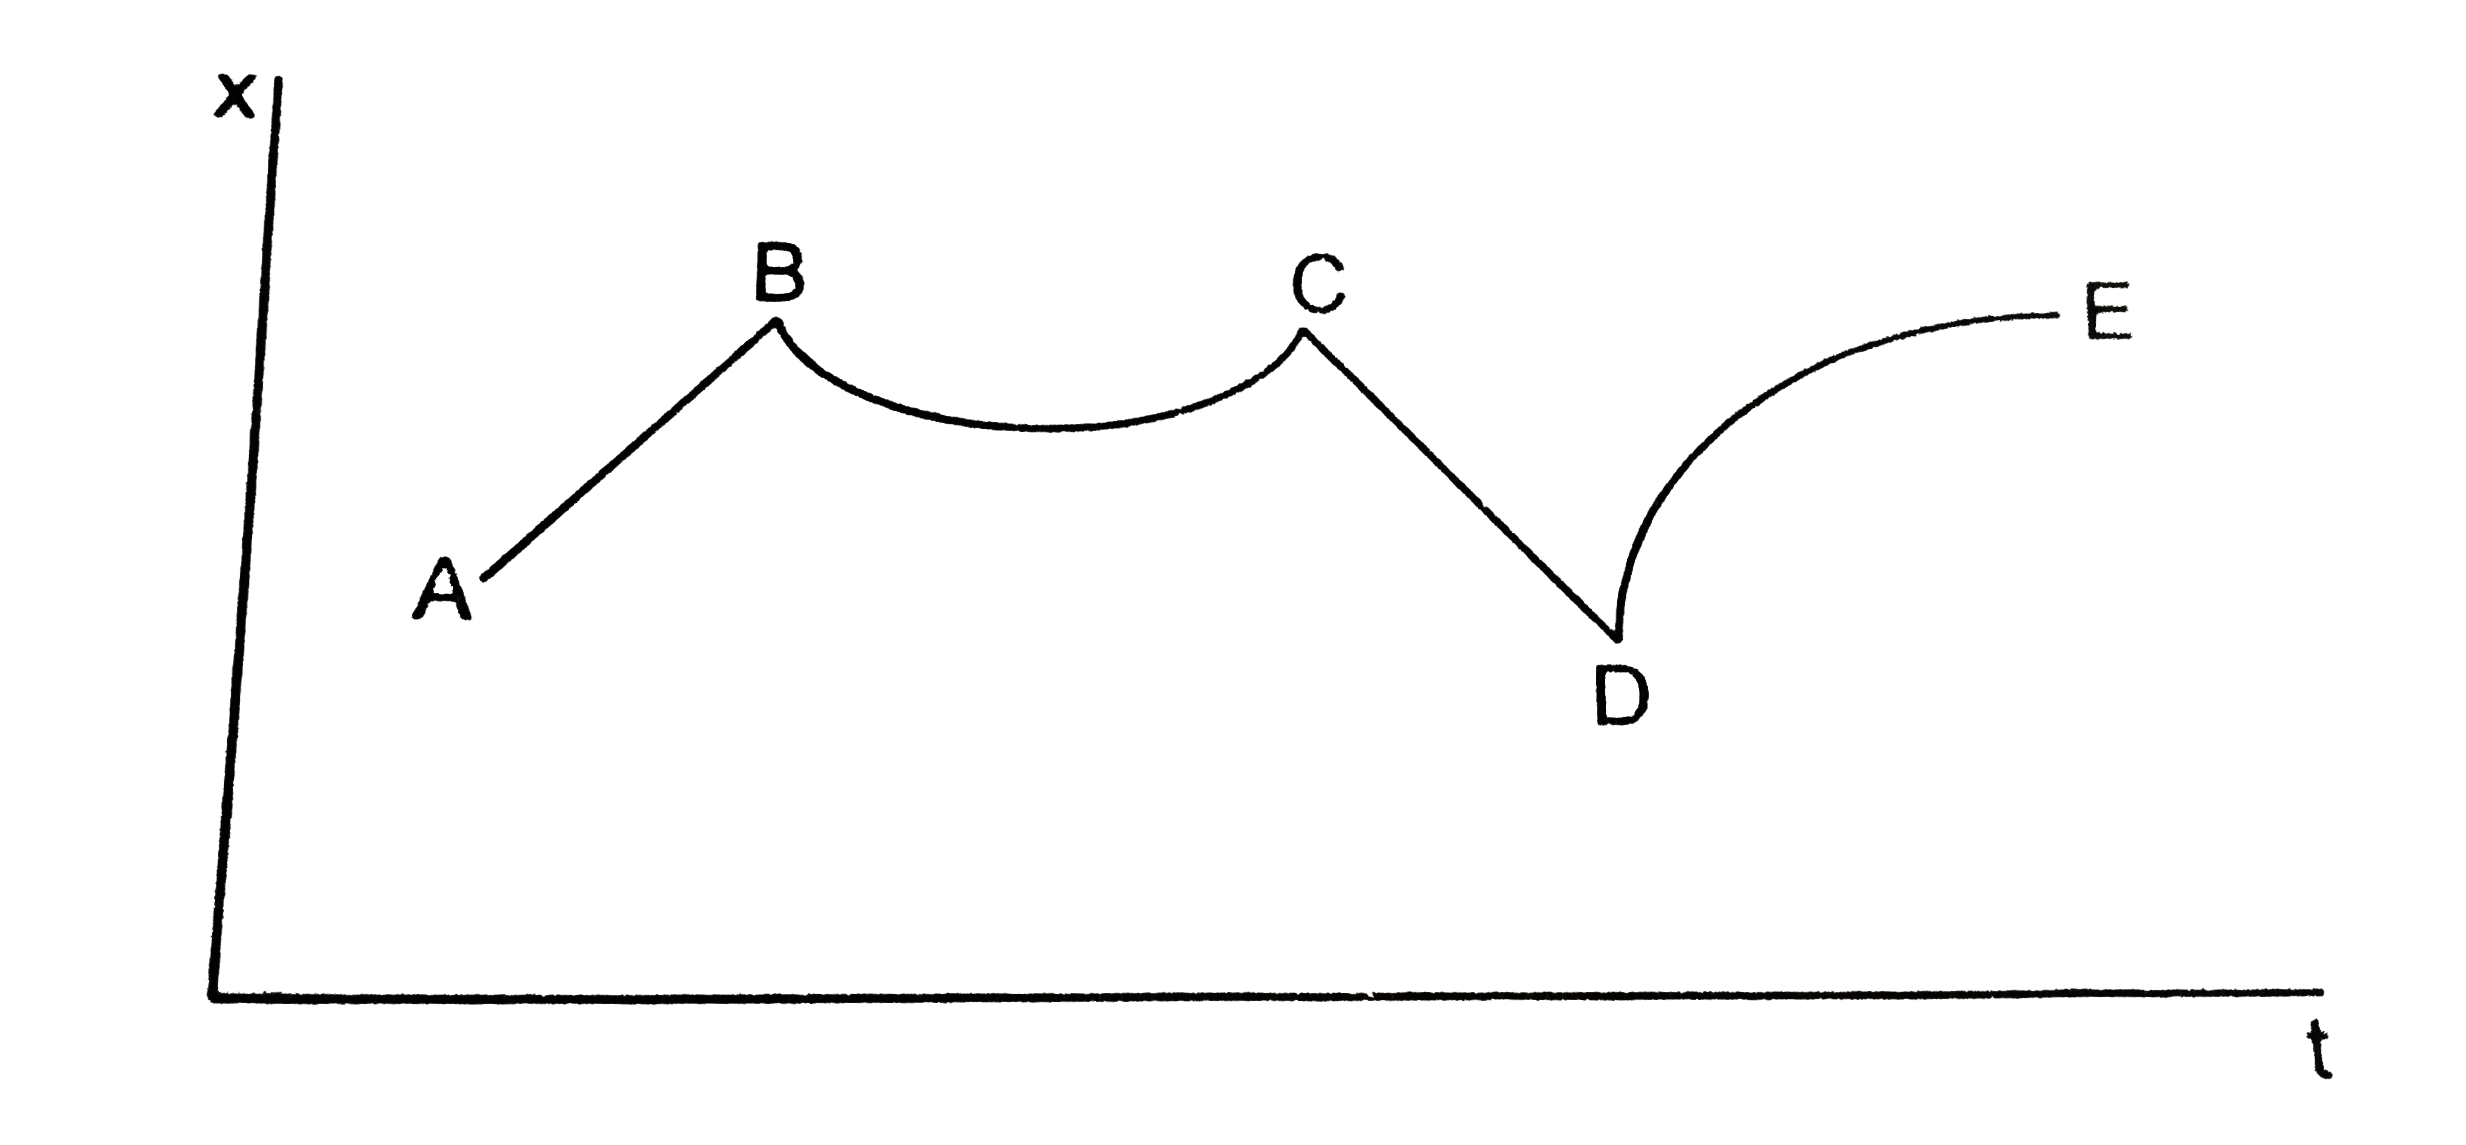
- Figure shows the displacement of a particle going along the X-axis as ...
Text Solution
|
- Figure shows the displacement time graph of a particle moving on the X...
Text Solution
|
- Figure shows the displacement of a particle going along the X-axis as ...
Text Solution
|
- The displacement time curve of a particle is shown in the figure. The ...
Text Solution
|
- चित्र में x-अक्ष पर चलते एक कण का विस्थापन समय के साथ बदलता हुआ दिखाया...
Text Solution
|
- The given figure shows a plot of the time dependent force F(x) acting ...
Text Solution
|
- Figure show the displacement - time graph of a particle moving on the ...
Text Solution
|
- दिया गया चित्र x-अक्ष पर गतिमान किसी कण की चाल के विस्थापन-समय (-1) ग्...
Text Solution
|
- Figure shows the displacement time graph of a particle moving on the X...
Text Solution
|