


Similar Questions
Explore conceptually related problems
Recommended Questions
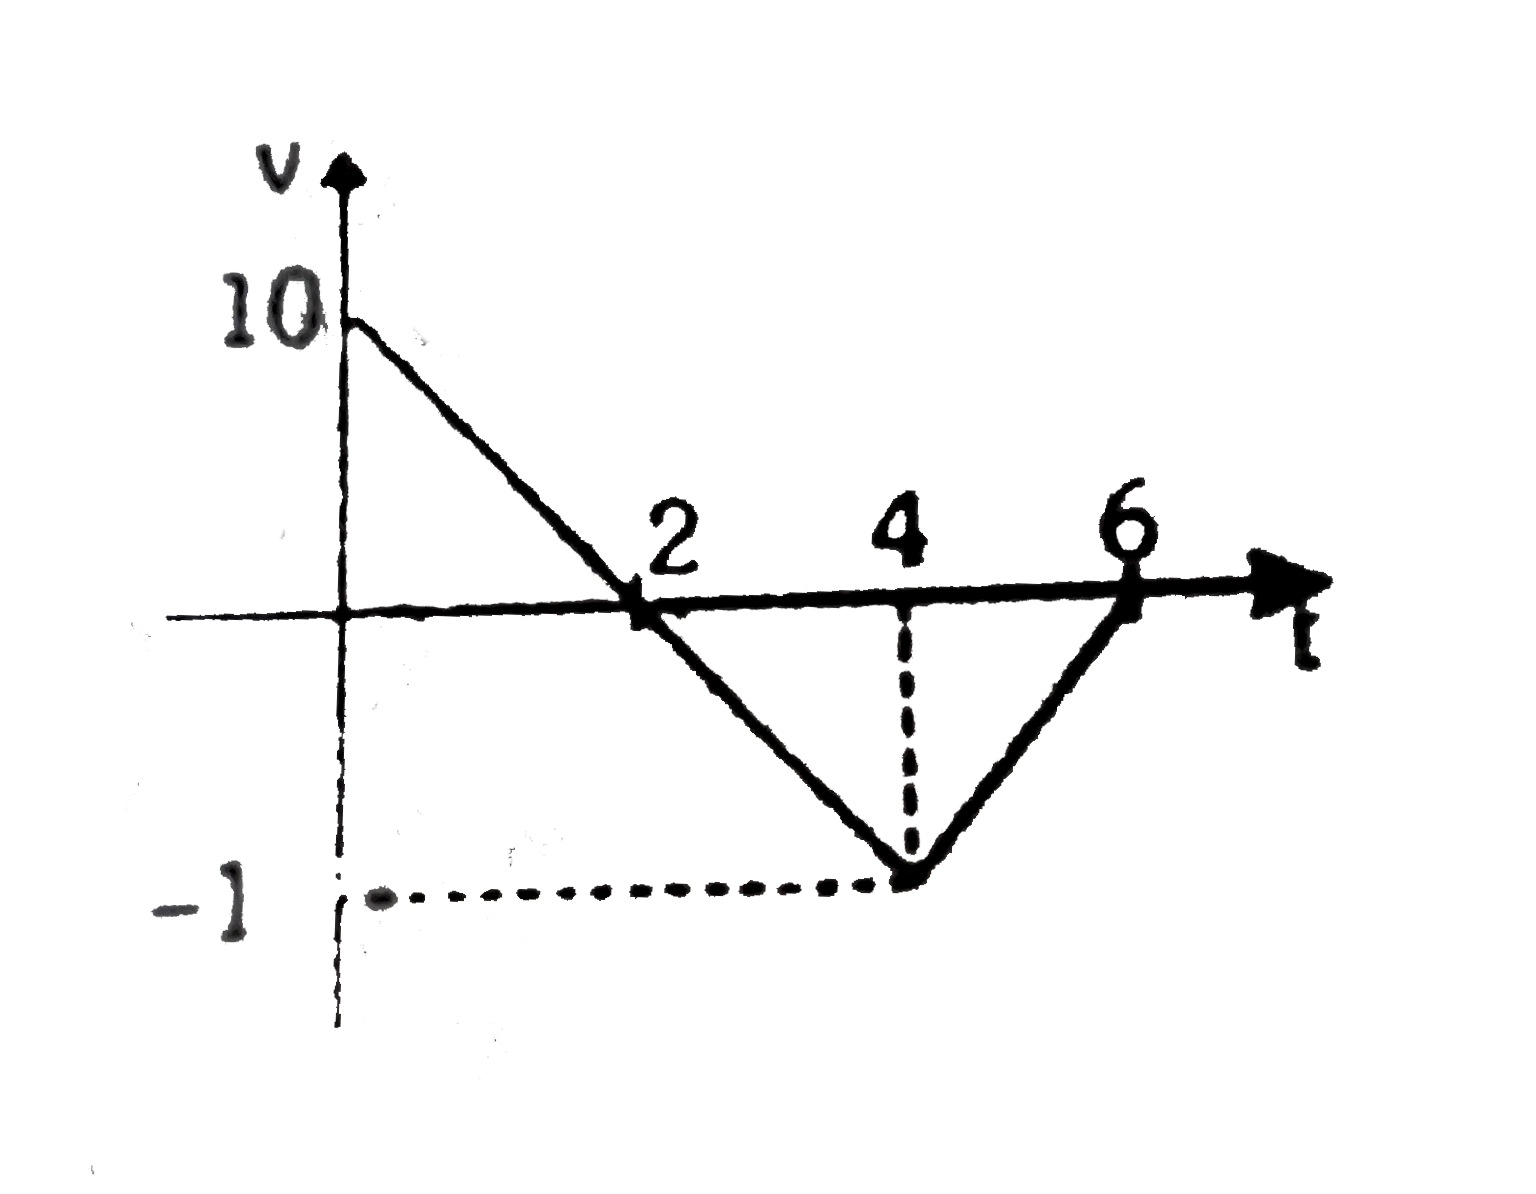
- For the velocity -time graph shown in figure, in a time interval from ...
Text Solution
|
- In the diagram shown in figure, match the following (g=10 m//s^(2)) ...
Text Solution
|
- For the velocity -time graph shown in figure, in a time interval from ...
Text Solution
|
- A balloon rises up with constant net acceleration of 10 m//s^(2) . Aft...
Text Solution
|
- In the s-t equation (s=10+20 t-5t^(2)) match the following columns. ...
Text Solution
|
- In the diagram shown in figure, match the following columns (take g=10...
Text Solution
|
- Match the entries in Column A with entries in Column B {:(,"Column A",...
Text Solution
|
- त्वरण का S.I. मात्रक मीटर/सेकण्ड है ।
Text Solution
|
- The velocity of Boat in still water is 3m/s. Velocity river is 4m/s. W...
Text Solution
|