


Similar Questions
Explore conceptually related problems
Recommended Questions
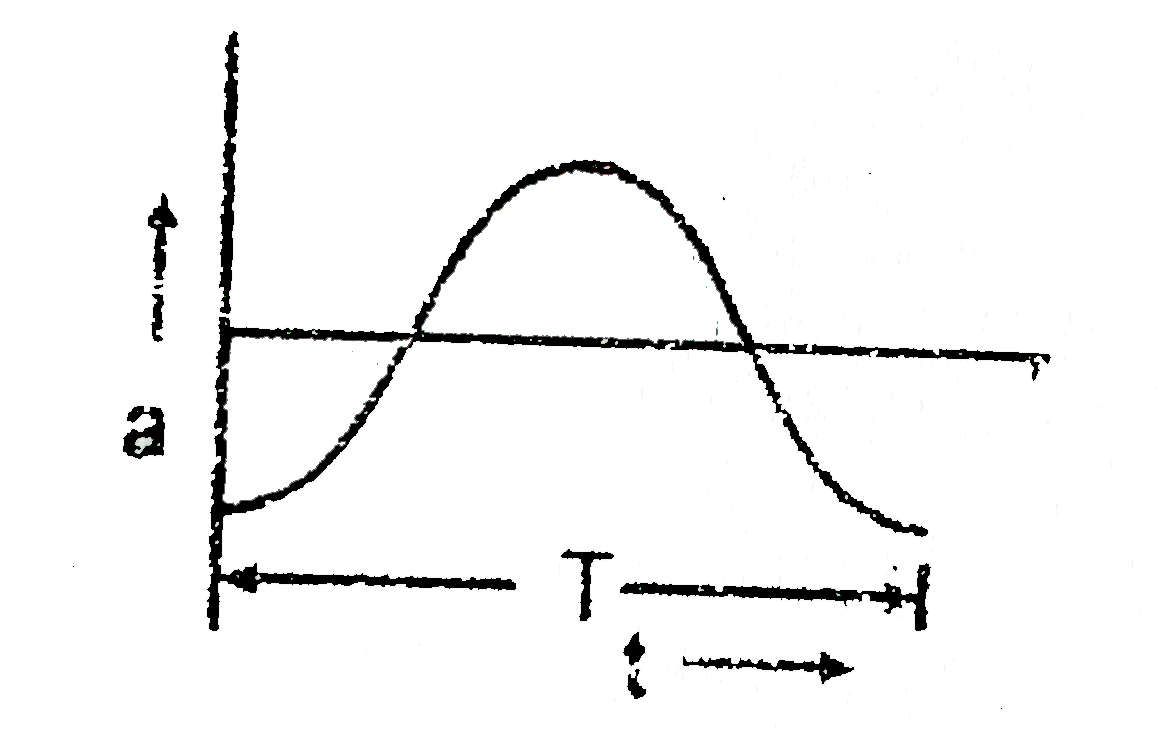
- Acceleration a versus time t graph of a body in SHM is given by a curv...
Text Solution
|
- i.The acceleration versus time graph of a partical SHM is shown in the...
Text Solution
|
- The graph below shws the velocity versus time graph for a body Wh...
Text Solution
|
- Acceleration A and time period T of a body in S.H.M. is given by a cur...
Text Solution
|
- Acceleration versus time graph of a body in SHM is given by a curve sh...
Text Solution
|
- Acceleration a versus time t graph of a body in SHM is given by a curv...
Text Solution
|
- Acceleration versus time graph of a particle moving in a straight line...
Text Solution
|
- The graph in figure shows the velocity v versus time t for a body. Whi...
Text Solution
|
- The displacement -time (x– t) graph of a body is given as The co...
Text Solution
|