Home
Class 10
MATHS
The lengths of 40 leaves of a plant are ...

The lengths of 40 leaves of a plant are measured correct to the nearest millimeter and the data obtained is represented in the following table :
Find the median length of the leaves.

Text Solution

Verified by Experts

The correct Answer is:
146.75 mm
Promotional Banner

Topper's Solved these Questions

  • SOME APPLICATIONS OF TRIGONOMETRY

    MBD -HARYANA BOARD|Exercise EXERCISE (LONG ANSWER TYPE QUESTIONS)|12 Videos
  • SURFACE AREAS AND VOLUMES

    MBD -HARYANA BOARD|Exercise LONG ANSWER TYPE QUESTIONS|16 Videos

Similar Questions

Explore conceptually related problems

The lengths of 40 leaves of a plant are measured correct to the nearest millimetre, and the data obtained is represented in the following table : Find the median length of the leaves. (Hint: The data needs to be converted to continuous classes for finding the median, since the formula assumes continuous classes. The classes then change to 117.5- 126.5,126.5 - 135.5,..171.5 -180.5.)

The lengths of 40 leaves of a plant are measured correct to the nearest millimetre, and the data obtained is represented in the following table: Length (in mm): 118-126 127-135 136-144 145-153 154-162 163-171 172-180 No. of leaves: 3 5 9 12 5 4 2 Find the mean length of leaf.

The length of 40 leaves of a plant are measured correct to one millimetre, and the obtained data is represented in the following table: Is there any other suitable graphical representation for the same data?

The length of 40 leaves of a plant are measured correct to one millimetre, and the obtained data is represented in the following table: Is it correct to conclude that the maximum number of leaves are 153 mm long? Why?

The length of 40 leaves of a plant are measured correct to one millimetre, and the obtained data is represented in the following table: Draw a histogram to represent the given data. [Hint: First make the class intervals continuous]

The length of 40 leaves of a plant are measured correct to one millimetre, and the obtained data is represented in the following table: (i) Draw a histogram to represent the given data. (ii) Is there any other suitable graphical representation for the same data? (iii) Is it correct to conclude that the maximum number of leaves are 153 mm long? Why?

The length of 40 leaves of a plant are measured correct to nearest millimetres. The data obtained is as follows : Draw histogram to represent the given data.

The lengths of 62 levels of a plant are measured in millimetres and the data is represented in the following table Draw a histrogram to represent the data above.

MBD -HARYANA BOARD-STATISTICS -LONG ANSWER TYPE QUESTIONS
  1. Consider the following distribution of daily wages of 50 workers of a ...

    Text Solution

    |

  2. The following table gives the literacy rate (in percentage) of 35 c...

    Text Solution

    |

  3. A survey regarding the heights (in cm) of 51 girls of Class X of a sch...

    Text Solution

    |

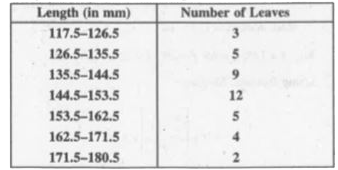
  4. The lengths of 40 leaves of a plant are measured correct to the neares...

    Text Solution

    |

  5. The table below shows daily expenditure on food of 25 households in a ...

    Text Solution

    |

  6. The table below gives the percentage distribution of female teachers i...

    Text Solution

    |

  7. The following distribution gives the monthly consumption of consumers ...

    Text Solution

    |

  8. The following data gives the information on the life time (in hours ) ...

    Text Solution

    |

  9. The following distribution shows the daily pocket money of children of...

    Text Solution

    |

  10. The length of 40 leaves of a plant are measured in mm and are given in...

    Text Solution

    |

  11. Find the mean of the following frequency distribution:

    Text Solution

    |

  12. Find the mode of following frequency distribution :

    Text Solution

    |

  13. The following distribution shows the daily pocket allowance of chil...

    Text Solution

    |

  14. If the median of the distribution given below is 28.5, find the value...

    Text Solution

    |

  15. The distribution below gives the weights of 30 students of a class. Fi...

    Text Solution

    |

  16. 100 surnames ware randomly picked up from a local telephone directory ...

    Text Solution

    |

  17. The median of the following data is 525. find the the value of x and y...

    Text Solution

    |

  18. During the medical check up of 35 students of a class, their weights ...

    Text Solution

    |