Text Solution
Verified by Experts
The correct Answer is:


Topper's Solved these Questions
MBD NEW STYPE MODEL TEST PAPER - 2
MBD -HARYANA BOARD|Exercise SET - D (SECTION - A)|16 VideosMBD NEW STYPE MODEL TEST PAPER - 2
MBD -HARYANA BOARD|Exercise SET - D (SECTION - B)|3 VideosMBD NEW STYPE MODEL TEST PAPER - 2
MBD -HARYANA BOARD|Exercise SET - C (SECTION - C)|5 VideosMBD NEW STYLE MODEL TEST PAPER -1
MBD -HARYANA BOARD|Exercise SET - D (SECTION - D)|4 VideosPAIR OF LINEAR EQUATIONS IN TWO VARIABLES
MBD -HARYANA BOARD|Exercise SHORT ANSWER TYPE QUESTIONS|20 Videos
Similar Questions
Explore conceptually related problems
MBD -HARYANA BOARD-MBD NEW STYPE MODEL TEST PAPER - 2-SET - C (SECTION - D)
- The difference of squares of two number is 180. The square of the smal...
Text Solution
|
- A statue 1.6 m tall stands on the top of a pedestral . From a point on...
Text Solution
|
- Prove that : (Using identify "cosec"^2A = 1 + cot^2 A) (cosA - sinA...
Text Solution
|
- How many silver coins 1.75 cm in diameter and of thickness 2 nm, must ...
Text Solution
|
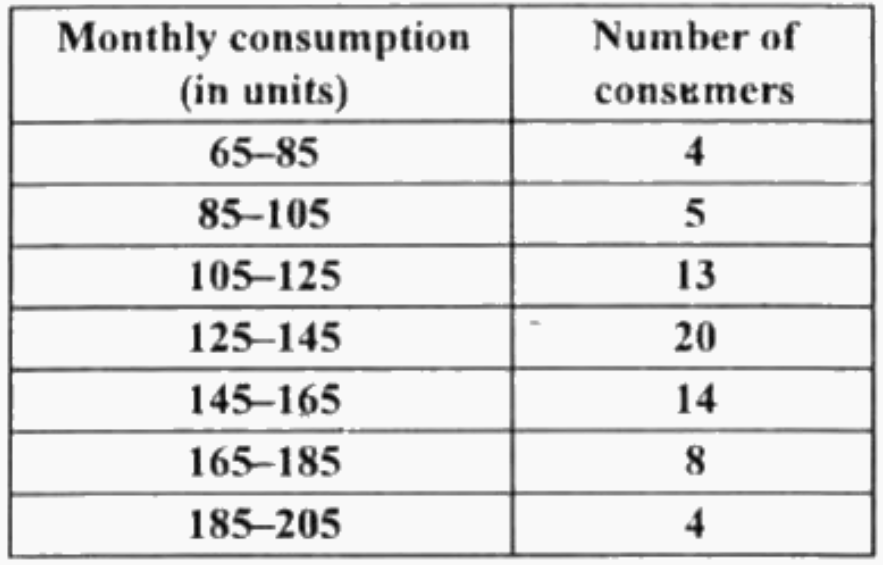
- The following frequency distribution gives the monthly consumption of...
Text Solution
|