


Similar Questions
Explore conceptually related problems
Recommended Questions
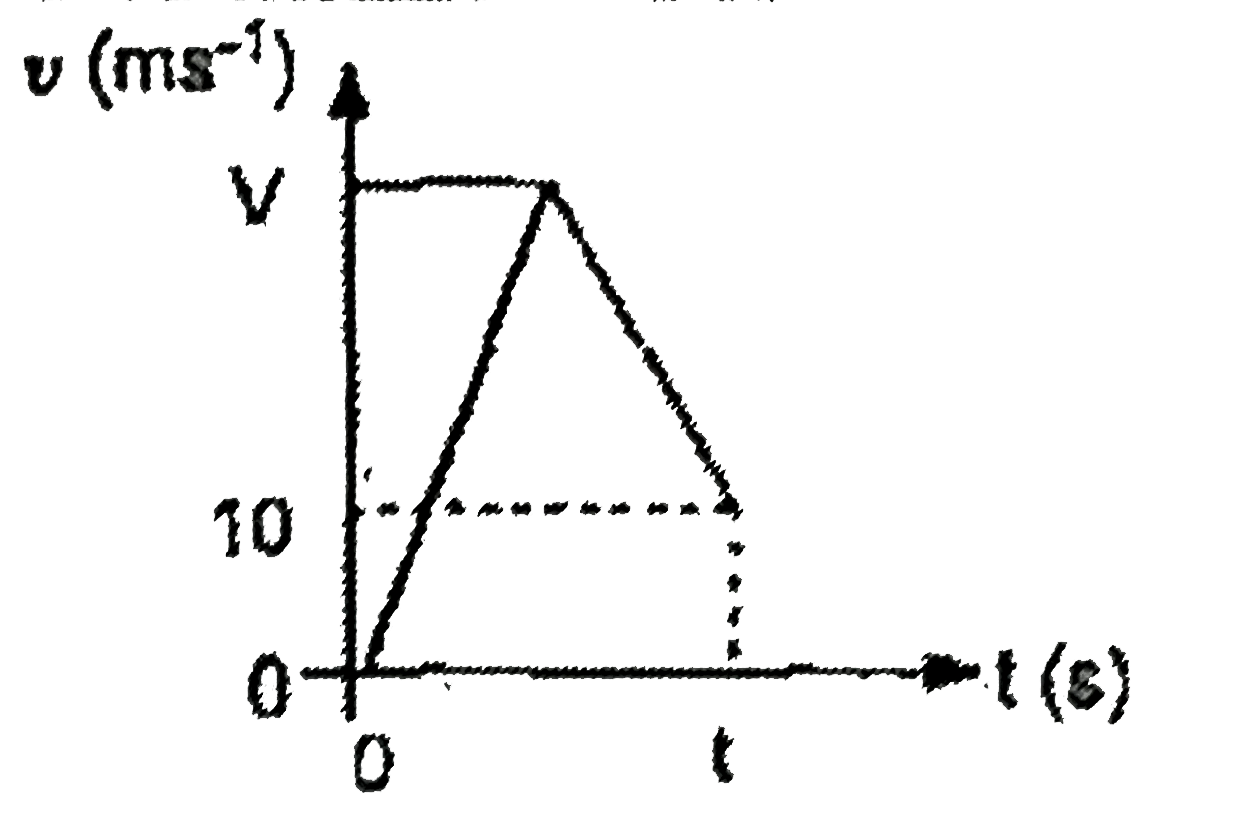
- (The figure shows the (V,t) graph for the train .accelerating' ifrom r...
Text Solution
|
- A particle starts from rest, accelerates at 2(m)/(s^2) for 10 s and th...
Text Solution
|
- A particle starts from rest, accelerates at 2(m)/(s^2) for 10 s and th...
Text Solution
|
- Two trains travelling on the same track are approaching each other wit...
Text Solution
|
- (The figure shows the (V,t) graph for the train .accelerating' ifrom r...
Text Solution
|
- [" III.A train starts from rest and is "],[" accelerated with an accel...
Text Solution
|
- [" III.A train starts from rest and is "],[" accelerated with an accel...
Text Solution
|
- A car, starting from rest, accelerates at the rate f through a distanc...
Text Solution
|
- The greatest acceleration or deceleration that a train may have is a. ...
Text Solution
|