


Similar Questions
Explore conceptually related problems
Recommended Questions
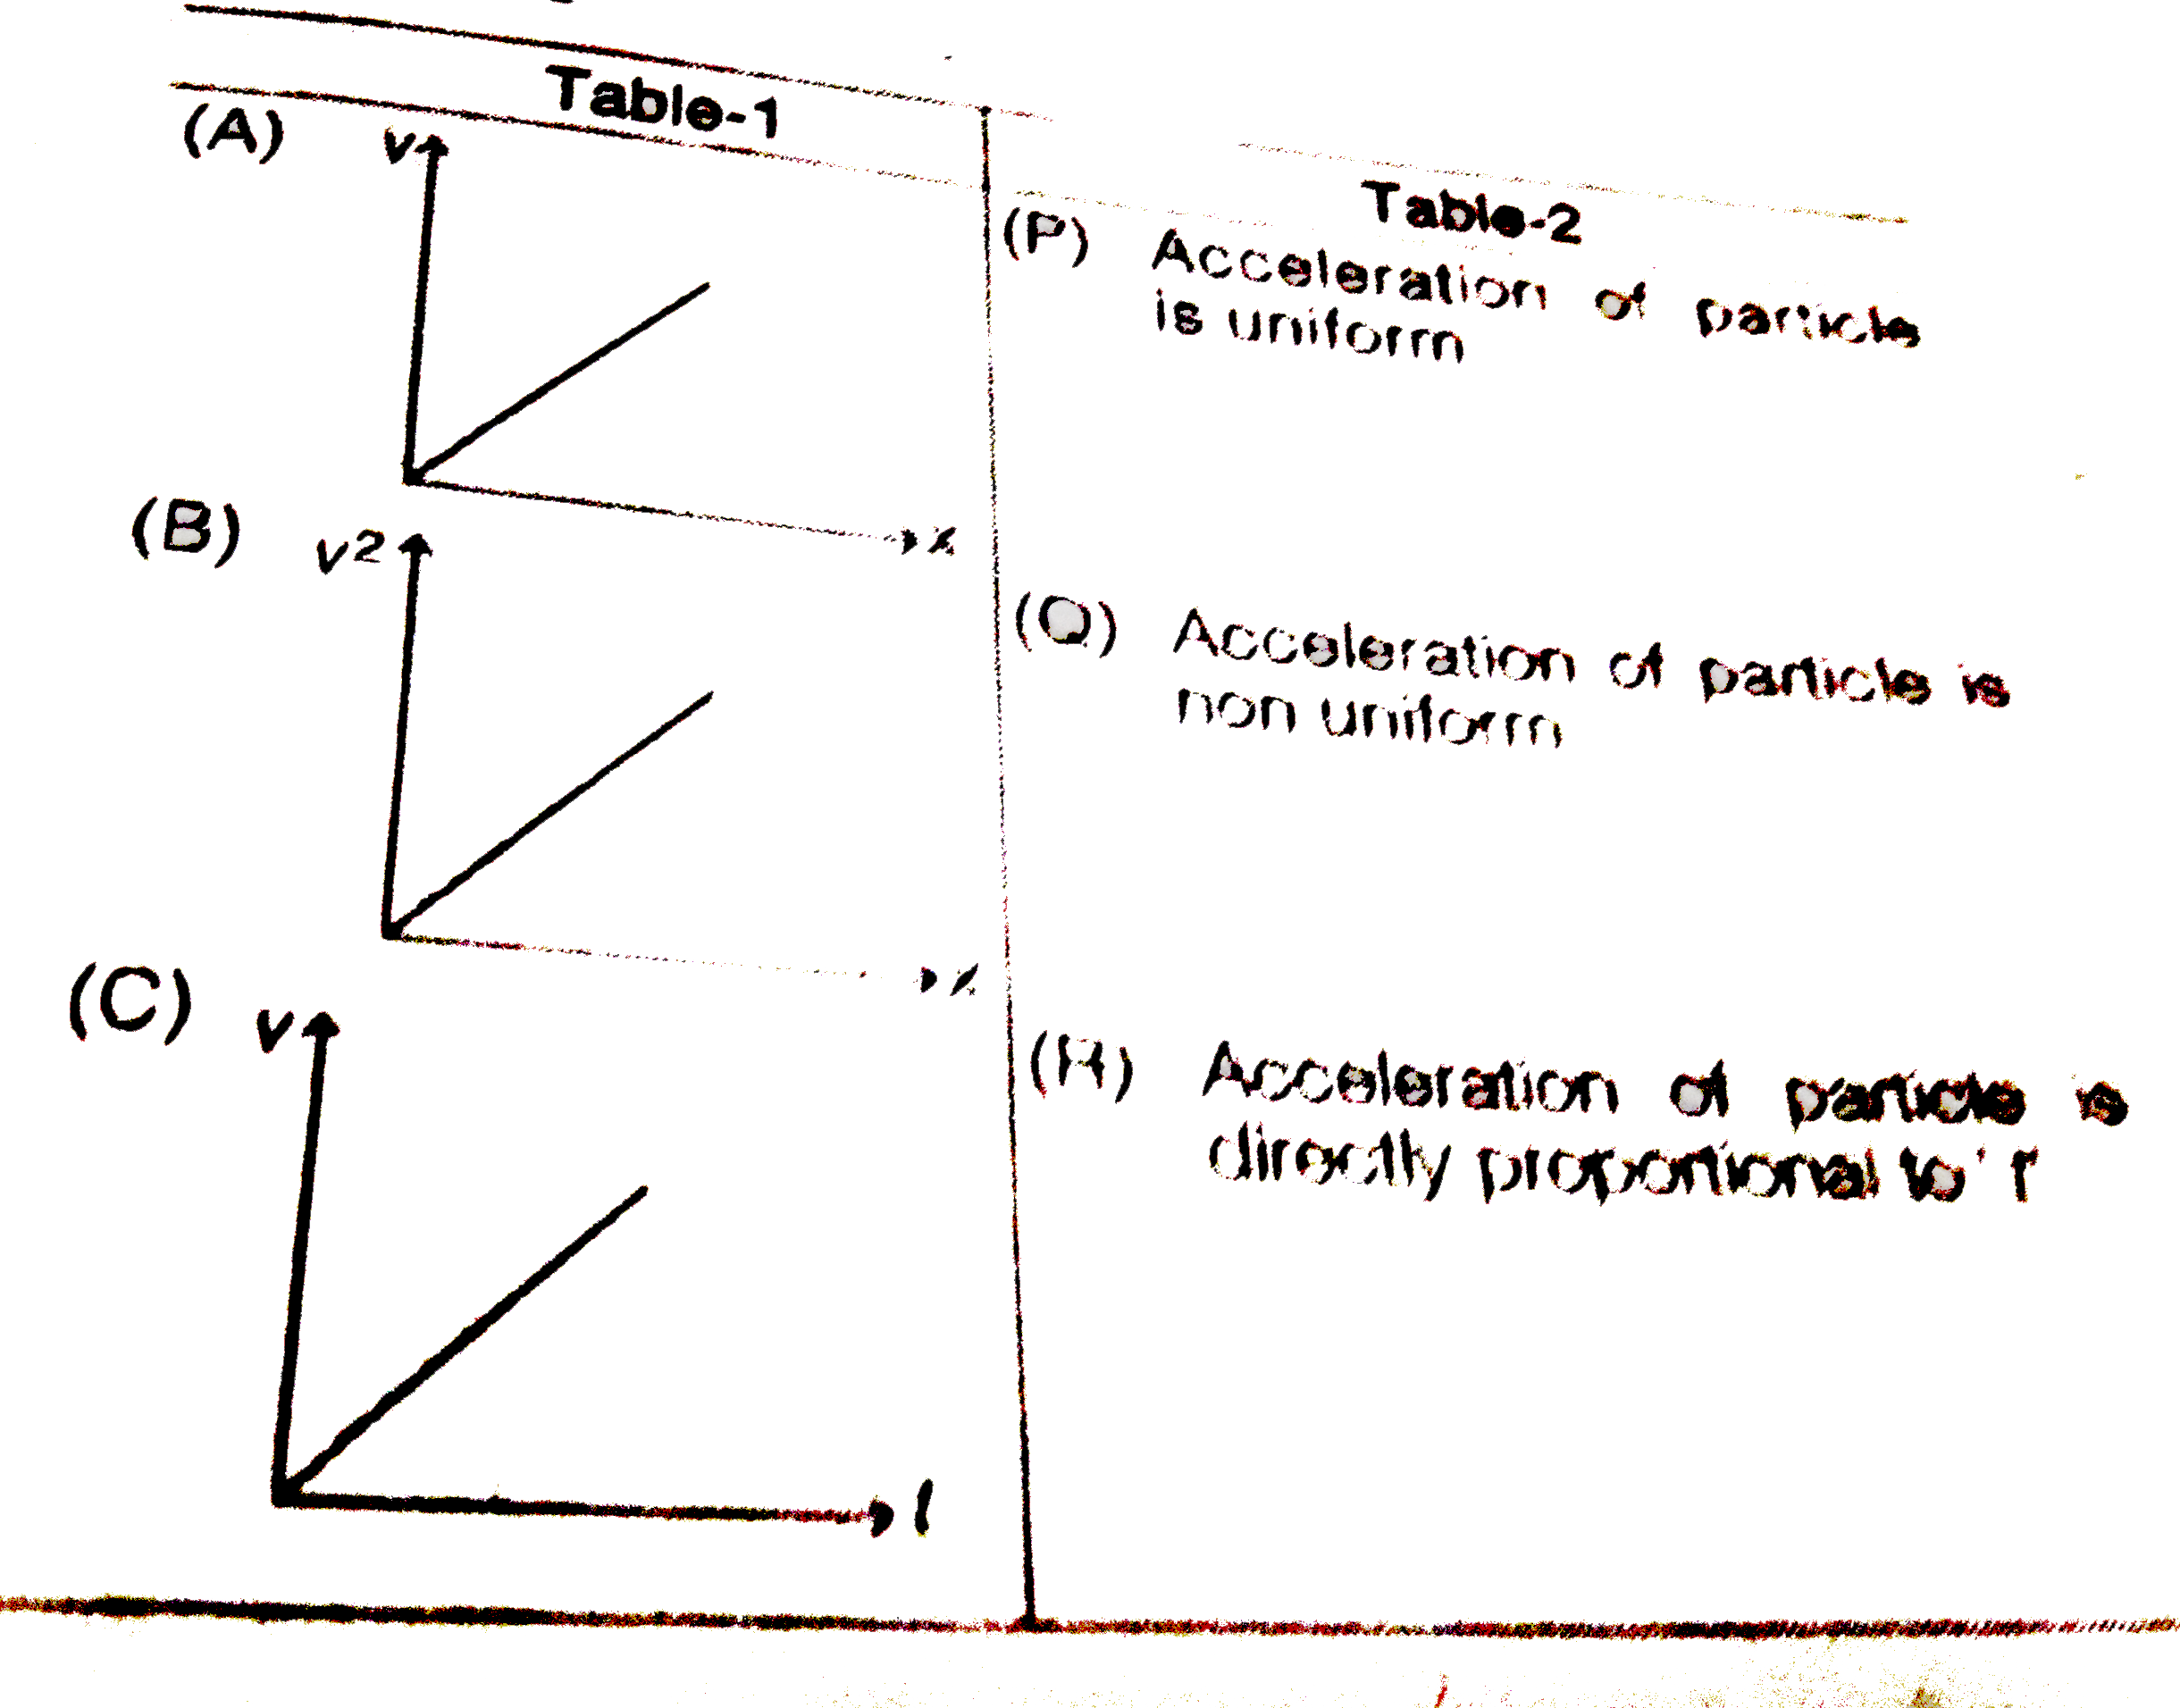
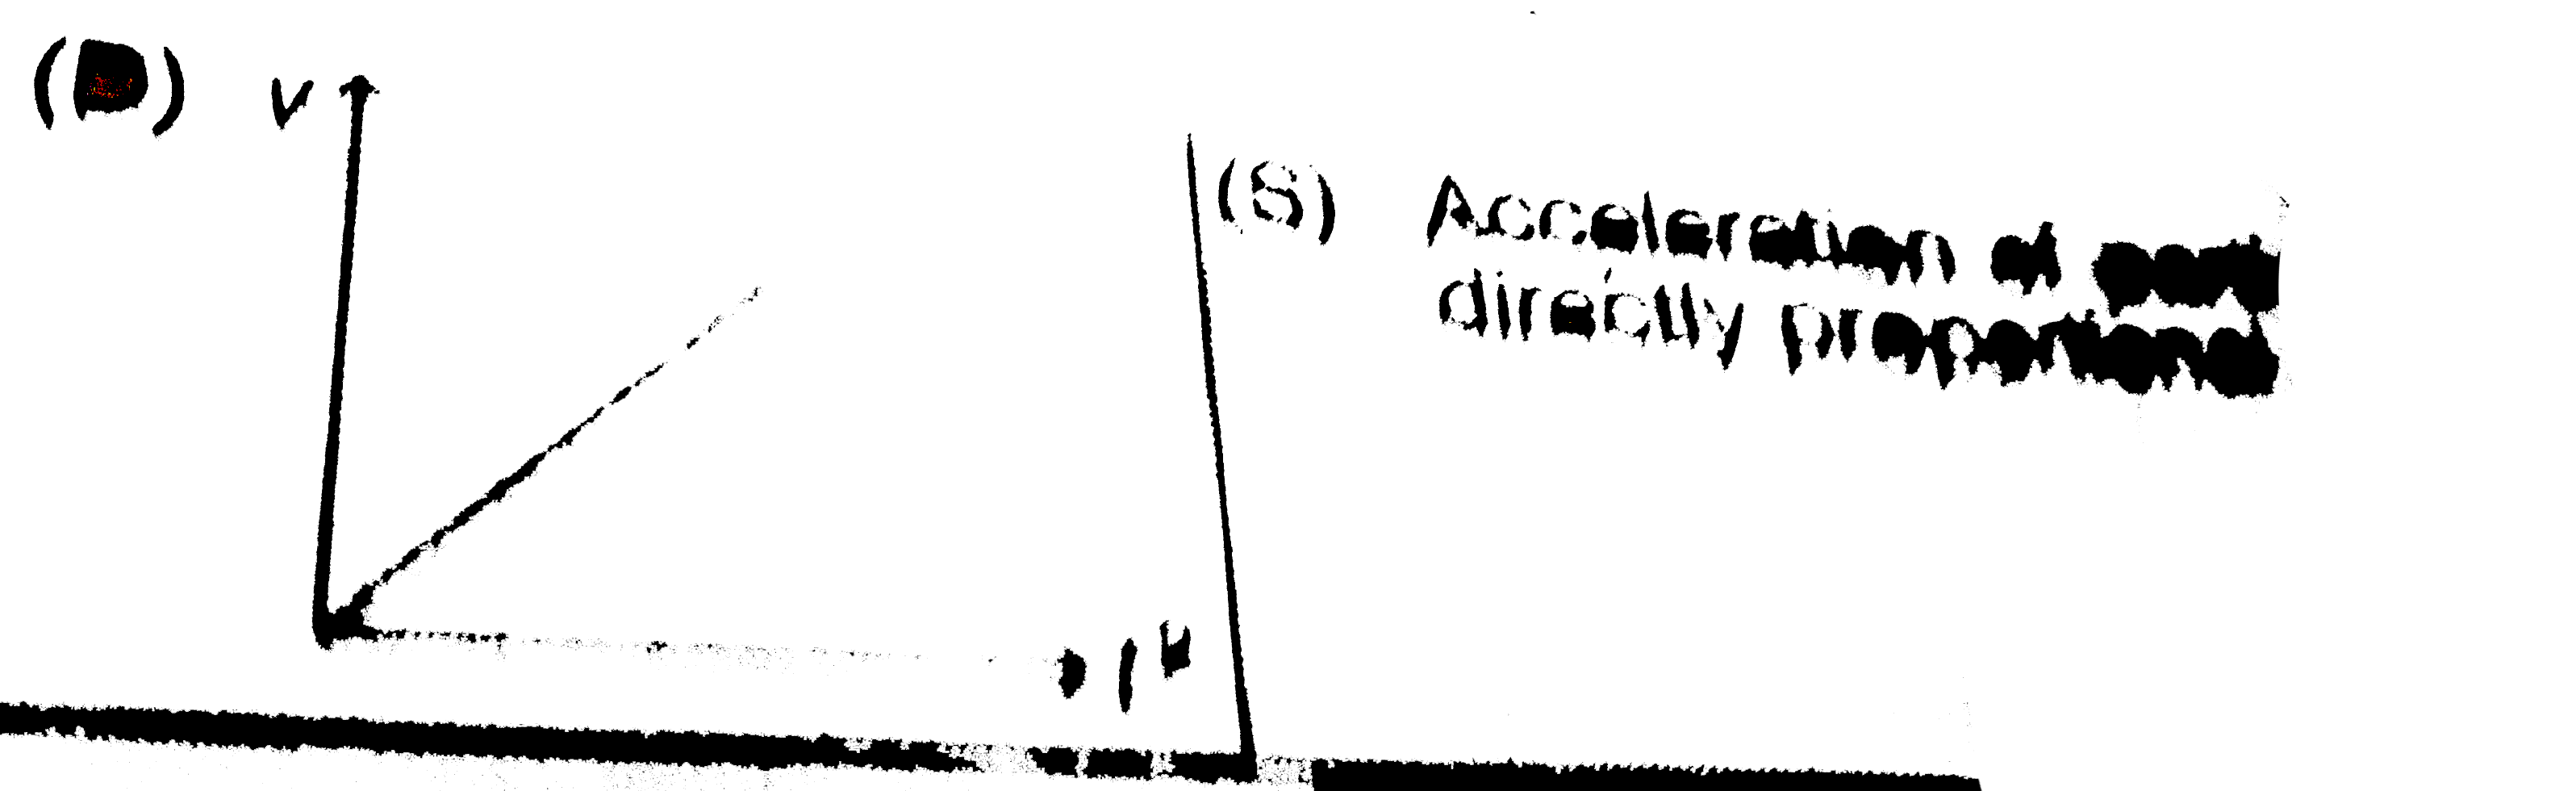
- Table -1 gives some graph for a particle moves along x-axis in positiv...
Text Solution
|
- The x-t graph of a particle moving along a straight line is shown in f...
Text Solution
|
- Position-time graph for a particle moving along x- direction is as sho...
Text Solution
|
- The position of a particle moving along x-axis varies eith time t as x...
Text Solution
|
- Each situation in Table-1 gives graph of a particle moving in circular...
Text Solution
|
- Table -1 gives some graph for a particle moves along x -axis in positi...
Text Solution
|
- Velocity (in m/s) of a particle moving in a straight line given by v=(...
Text Solution
|
- A particle moves along x-axis. At time t = 0, the particle is at origi...
Text Solution
|
- A particle moves along x-axis. At time t = 0, the particle is at origi...
Text Solution
|