


Similar Questions
Explore conceptually related problems
Recommended Questions
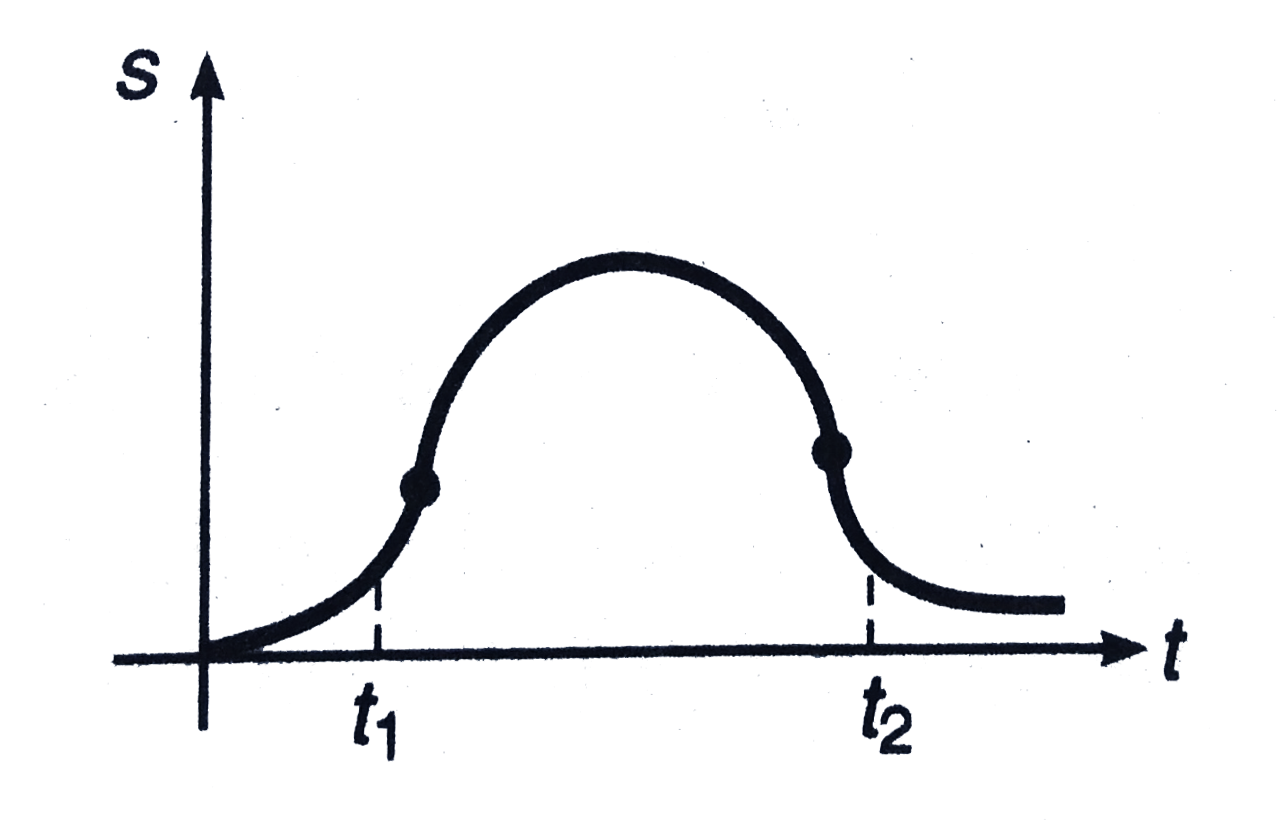
- Figure shows the displacement-time graph of a particle moving in a str...
Text Solution
|
- Figure shows the x coordinate of a particle as a function of time. Fin...
Text Solution
|
- Figure shows the displacement-time graph of a particle moving in a str...
Text Solution
|
- The diagram shows the displacement-time graph for a particle moving in...
Text Solution
|
- The figure shows a velocity-time graph of a particle moving along a st...
Text Solution
|
- The velocity -time (v - t) graph of a particle moving in a straight li...
Text Solution
|
- The diagram shows the displacement - time graph for a particle moving ...
Text Solution
|
- सरल रेखा में गति करते हुए एक कण का त्वरण समय ग्राफ चित्र में प्रदर्शित...
Text Solution
|
- Displacement-time graph of a particle moving in a straight line is as ...
Text Solution
|