Home
Class 14
MATHS
ग्राफ में किसी देश विभिन्न वर्षो में एक्...

ग्राफ में किसी देश विभिन्न वर्षो में एक्सचेंजरिजर्व को दर्शाया गया हैं ग्राफ का अध्ययन कीजिए और निम्नलिखित प्रश्नों के उत्तर दीजिए।

ऐसे वर्षो की संख्या जिसमें एक्सचेंज औसत रिजर्व से उपर रहा हो और ऐसे वर्षो की संख्या जिसमें औसत, रिजर्व से नीचे रहा हो, का अनुपात क्या होगा ?

Promotional Banner

Similar Questions

Explore conceptually related problems

The graph shows the monthly expenditure of a company (unit = 10 lakhs). Study the graph and answer the questions : The ratio between transport and employee salary on monthly basis is ग्राफ में किसी कम्पनी के मासिक व्यय को दर्शाया गया है। ग्राफ का अध्ययन कीजिए और निम्नलिखित प्रश्नों के उत्तर दीजिए। मासिक आधार पर परिवहन और कर्मचारियों के वेतन के बीच अनुपात कितना है ?

Study the Bar diagram carefully and answer the question. The Bar diagram shows the trends of foreign direct investment (FDI) into India from all over the World Gin Rs. crores) The year which exhibited the 2nd highest growth percentage in FDI in India over the period shown is बार ग्राफ में समस्त विश्व से भारत में विदेशी प्रत्यक्ष निवेश (एफ डी आई) की प्रवृत्ति को दर्शाया गया है। बार ग्राफ का ध्यानपूर्वक अध्ययन कीजिए और प्रश्नों का उत्तर दीजिए। दर्शायी गयी अवधि में भारत में किस वर्ष सर्वाधिक विदेशी प्रत्यक्ष निवेश किया गया ?

The distribution of fruit consumption in a sample of 73 seventeen-year-old girls is given in the graph below. Study the graph and answer the questions : How many of these girls ate more than two servings but less than six servings per day? निम्नलिखित ग्राफ में 72 सत्रह - वर्षीय लड़कियों के सैम्पल में फलों की खपत (उपभोग) के विवरण को दर्शाया गया है। ग्राफ का अध्ययन कीजिए और प्रश्नों के आधार पर उत्तर दीजिए: इनमें से कितनों लड़कियों ने प्रति दिन दो से अधिक किन्तु छह से कम आपूर्ति किए गए फलों को खाया?

The distribution of fruit consumption in a sample of 73 seventeen-year-old girls is given in the graph below. Study the graph and answer the questions : What percent of these girls ate six or more servings per day? निम्नलिखित ग्राफ में 72 सत्रह - वर्षीय लड़कियों के सैम्पल में फलों की खपत (उपभोग) के विवरण को दर्शाया गया है। ग्राफ का अध्ययन कीजिए और प्रश्नों के आधार पर उत्तर दीजिए: प्रति दिन छह या अधिक आपूर्ति किए गए फलों को खाने वाली इन लड़कियों का प्रतिशत क्या था?

Study the Bar diagram carefully and answer the question. The Bar diagram shows the trends of foreign direct investment (FDI) into India from all over the World Gin Rs. crores) The ratio of investment in 1997 to the average investment बार ग्राफ में समस्त विश्व से भारत में विदेशी प्रत्यक्ष निवेश (एफ डी आई) की प्रवृत्ति को दर्शाया गया है। बार ग्राफ का ध्यानपूर्वक अध्ययन कीजिए और प्रश्नों का उत्तर दीजिए। वर्ष 1992 और 1997 में किए गए निवेश का अनुपात क्या है।

The distribution of fruit consumption in a sample of 73 seventeen-year-old girls is given in the graph below. Study the graph and answer the questions : How many of these girls ate fewer than two servings per day? निम्नलिखित ग्राफ में 72 सत्रह - वर्षीय लड़कियों के सैम्पल में फलों की खपत (उपभोग) के विवरण को दर्शाया गया है। ग्राफ का अध्ययन कीजिए और प्रश्नों के आधार पर उत्तर दीजिए: इनमें से कितनी लड़कियों ने प्रति दिन दो से कम आपूर्ति किए गए फलों को खाया?

Study the Bar diagram carefully and answer the question. The Bar diagram shows the trends of foreign direct investment (FDI) into India from all over the World Gin Rs. crores) The sum of FDI of 1992 and 1993 is बार ग्राफ में समस्त विश्व से भारत में विदेशी प्रत्यक्ष निवेश (एफ डी आई) की प्रवृत्ति को दर्शाया गया है। बार ग्राफ का ध्यानपूर्वक अध्ययन कीजिए और प्रश्नों का उत्तर दीजिए। वर्ष 1992 और 1999 में विदेशी प्रत्यक्ष निवेश का कुल योग कितना है ?

The graph shows the result of 10th class students of a school for 4 years. Study the graph and answer the questions: The number of students appeared for the 10th class exam in the year 2002 is. निम्नलिखित दण्ड आरेख 10 वीं कक्षा के छात्रों का 4 वर्ष का परीक्षा परिणाम दर्शाता है। आरेख का अध्ययन कीजिए और निम्नलिखित प्रश्नों का उत्तर दीजिए : छात्रों की संख्या वर्ष 2002 में 10 वीं कक्षा की परीक्षा में शामिल छात्रों की संख्या बताइए:

Recommended Questions
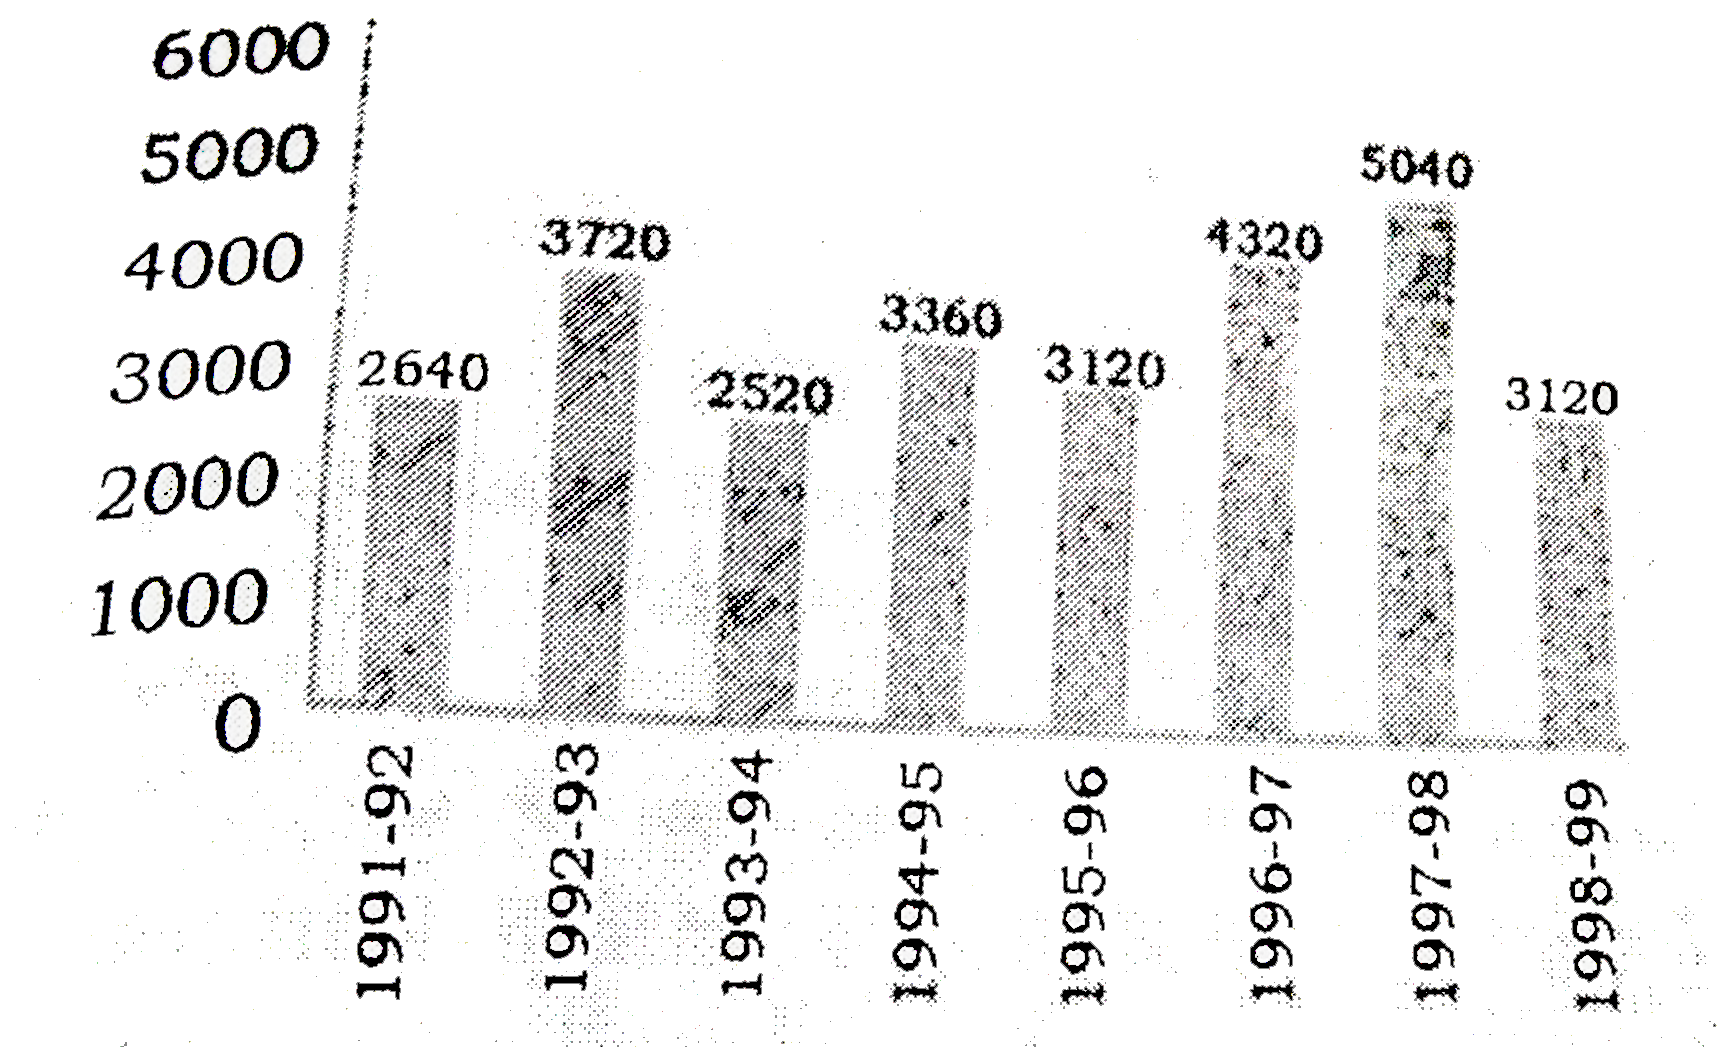
  1. ग्राफ में किसी देश विभिन्न वर्षो में एक्सचेंजरिजर्व को दर्शाया गया हैं...

    Text Solution

    |

  2. Match the following Column A to Column B

    Text Solution

    |

  3. निम्नलिखित प्रश्नों में से किसी एक प्रश्न का उत्तर लगभग 80 शब्दों में ...

    Text Solution

    |

  4. निचे दिये गये ग्राफ में दो प्रकार के वाहनों A व B के छ वर्षो के प्रद...

    Text Solution

    |

  5. निचे दिये गये ग्राफ में दो प्रकार के वाहनों A व B के छ वर्षो के प्रद...

    Text Solution

    |

  6. निचे दिये गये ग्राफ में दो प्रकार के वाहनों A व B के छ वर्षो के प्रद...

    Text Solution

    |

  7. निचे दिये गये ग्राफ में दो प्रकार के वाहनों A व B के छ वर्षो के प्रद...

    Text Solution

    |

  8. निचे दिये गये ग्राफ में दो प्रकार के वाहनों A व B के छ वर्षो के प्रद...

    Text Solution

    |

  9. निचे दिये गये ग्राफ में दो प्रकार के वाहनों A व B के छ वर्षो के प्रद...

    Text Solution

    |