Home
Class 14
MATHS
Study the following graph which shows in...

Study the following graph which shows income and expenditure of a company over the years 2005 - 2009 and answer the questions.

The percentage increase in expenditure of the company from 2007 to 2008 is

Promotional Banner

Topper's Solved these Questions

  • LINE GRAPH

    ARIHANT SSC|Exercise FAST TRACK PRACTICE|43 Videos
  • INDICES AND SURDS

    ARIHANT SSC|Exercise HIGHER SKILL LEVEL QUESTIONS|17 Videos
  • LINEAR EQUATIONS

    ARIHANT SSC|Exercise Higher Skill Level Questions|7 Videos

Similar Questions

Explore conceptually related problems

Study the following graph which shows income and expenditure of a company over the years and answer the questions. The percentage increase in income of the company from 2007 to 2008 is. निम्नलिखित चार्ट का अध्ययन कीजिए जिसमें कंपनी की कुछ वर्षों की आय एवं उसके व्यय को दर्शाया गया है और प्रश्नों के उत्तर दीजिए : वर्ष 2007 से 2008 तक कंपनी की आय में वृद्धि का प्रतिशत कितना रहा?

Study the following graph which shows income and expenditure of a company over the years and answer the questions. The difference in profit (in crores) of the company during 2007 and 2008 is. निम्नलिखित चार्ट का अध्ययन कीजिए जिसमें कंपनी की कुछ वर्षों की आय एवं उसके व्यय को दर्शाया गया है और प्रश्नों के उत्तर दीजिए : वर्ष 2007 और 2008 में कंपनी के लाभ में अंतर (₹ करोड़ में) कितना है?

The graph shows Income and Expenditure of a company. Study the graph and answer the questions. The profit was maximum in the year

The graph shows Income and Expenditure of a company. Study the graph and answer the questions. The income in 2002 was equal to the expenditure in the year

The graph shows Income and Expenditure of a company. Study the graph and answer the questions. The expenditure from 2002 to 2003 increased by

The graph shows Income and Expenditure of a company. Study the graph and answer the questions. The difference in profit between 2001 and 2002 is

ARIHANT SSC-LINE GRAPH-FAST TRACK PRACTICE
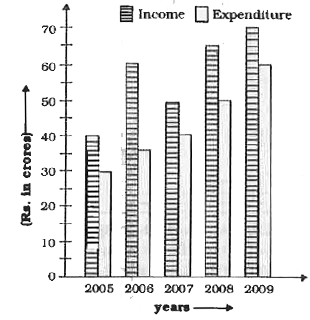
  1. Study the following graph which shows income and expenditure of a comp...

    Text Solution

    |

  2. Study the following graph carefully and answer the questions that ...

    Text Solution

    |

  3. Study the following graph carefully and answer the questions that ...

    Text Solution

    |

  4. Study the following graph carefully and answer the questions that ...

    Text Solution

    |

  5. Study the following graph carefully and answer the questions that ...

    Text Solution

    |

  6. Study the following graph carefully and answer the questions that ...

    Text Solution

    |

  7. Study the following graph carefully and answer the questions that ...

    Text Solution

    |

  8. Study the following graph carefully and answer the questions that ...

    Text Solution

    |

  9. Study the following graph carefully and answer the questions that ...

    Text Solution

    |

  10. Study the following graph carefully and answer the questions that ...

    Text Solution

    |

  11. Study the following graph carefully and answer the questions that ...

    Text Solution

    |

  12. Study the following graph carefully and answer the questions that foll...

    Text Solution

    |

  13. Study the following graph carefully and answer the questions that foll...

    Text Solution

    |

  14. Study the following graph carefully and answer the questions that foll...

    Text Solution

    |

  15. Study the following graph carefully and answer the questions that foll...

    Text Solution

    |

  16. Study the following graph carefully and answer the questions that foll...

    Text Solution

    |

  17. Study the following graph carefully and answer the questions that foll...

    Text Solution

    |

  18. Study the following graph carefully and answer the questions that foll...

    Text Solution

    |

  19. Study the following graph carefully and answer the questions that foll...

    Text Solution

    |

  20. Study the following graph carefully and answer the questions that foll...

    Text Solution

    |

  21. Study the following graph carefully and answer the questions that foll...

    Text Solution

    |