A
B
C
D
Text Solution
Verified by Experts
The correct Answer is:


Topper's Solved these Questions
Similar Questions
Explore conceptually related problems
ARIHANT SSC-PERCENTAGES-Final round
- The bar graph shown below reveals the data about the no. of students i...
Text Solution
|
- The bar graph shown below reveals the data about the no. of students i...
Text Solution
|
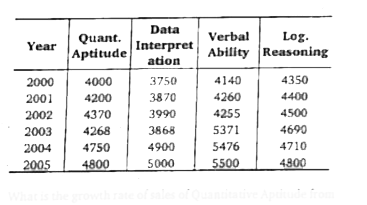
- The following table gives the sales details of the books for CAT writt...
Text Solution
|
- The following table gives the sales details of the books for CAT writt...
Text Solution
|
- The following table gives the sales details of the books for CAT writt...
Text Solution
|
- The following table gives the sales details of the books for CAT writt...
Text Solution
|
- In India there were only three bicycle making companies in the given p...
Text Solution
|
- In India there were only three bicycle making companies in the given p...
Text Solution
|
- In India there were only three bicycle making companies in the given p...
Text Solution
|
- Answer the questions based on the following information, which gives d...
Text Solution
|
- Answer the questions based on the following information, which gives d...
Text Solution
|
- Answer the questions based on the following information, which gives d...
Text Solution
|
- Answer the questions based on the following information, which gives d...
Text Solution
|
- The following pie chart shows the hourly distribution of all the major...
Text Solution
|
- The following pie chart shows the hourly distribution of all the major...
Text Solution
|
- The following pie chart shows the hourly distribution of all the major...
Text Solution
|
- The following pie chart shows the hourly distribution of all the major...
Text Solution
|
- The following pie chart shows the hourly distribution of all the major...
Text Solution
|
- The two pie charts show the market share of different companies which ...
Text Solution
|
- The two pie charts show the market share of different companies which ...
Text Solution
|