A
B
C
D
Text Solution
Verified by Experts
The correct Answer is:


ARIHANT SSC-PERCENTAGES-Final round
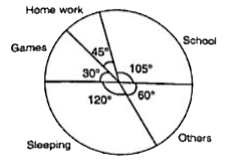
- The following pie chart shows the hourly distribution of all the major...
Text Solution
|
- The following pie chart shows the hourly distribution of all the major...
Text Solution
|
- The following pie chart shows the hourly distribution of all the major...
Text Solution
|
- The following pie chart shows the hourly distribution of all the major...
Text Solution
|
- The following pie chart shows the hourly distribution of all the major...
Text Solution
|
- The two pie charts show the market share of different companies which ...
Text Solution
|
- The two pie charts show the market share of different companies which ...
Text Solution
|
- The two pie charts show the market share of different companies which ...
Text Solution
|
- The two pie charts show the market share of different companies which ...
Text Solution
|
- Number of different colleges in India in different years is given in t...
Text Solution
|
- Number of different colleges in India in different years is given in t...
Text Solution
|
- Number of different colleges in India in different years is given in t...
Text Solution
|
- Number of different colleges in India in different years is given in t...
Text Solution
|
- Number of different colleges in India in different years is given in t...
Text Solution
|
- Answer the question based on the following information. The following ...
Text Solution
|
- Answer the question based on the following information. The following ...
Text Solution
|
- Answer the question based on the following information. The following ...
Text Solution
|
- Answer the question based on the following information. The following ...
Text Solution
|
- Answer the question based on the following information. The following ...
Text Solution
|
- A marketing company conducted a survey among 10,000 person in Kanpur :...
Text Solution
|