A
B
C
D
Text Solution
Verified by Experts
The correct Answer is:


Topper's Solved these Questions
Similar Questions
Explore conceptually related problems
ARIHANT SSC-PERCENTAGES-Final round
- The following pie chart shows the hourly distribution of all the major...
Text Solution
|
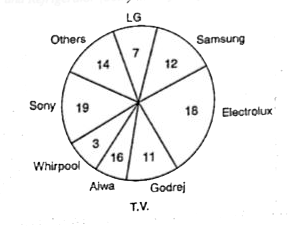
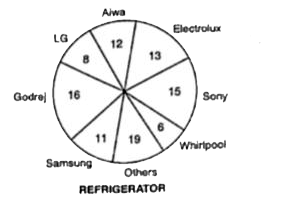
- The two pie charts show the market share of different companies which ...
Text Solution
|
- The two pie charts show the market share of different companies which ...
Text Solution
|
- The two pie charts show the market share of different companies which ...
Text Solution
|
- The two pie charts show the market share of different companies which ...
Text Solution
|
- Number of different colleges in India in different years is given in t...
Text Solution
|
- Number of different colleges in India in different years is given in t...
Text Solution
|
- Number of different colleges in India in different years is given in t...
Text Solution
|
- Number of different colleges in India in different years is given in t...
Text Solution
|
- Number of different colleges in India in different years is given in t...
Text Solution
|
- Answer the question based on the following information. The following ...
Text Solution
|
- Answer the question based on the following information. The following ...
Text Solution
|
- Answer the question based on the following information. The following ...
Text Solution
|
- Answer the question based on the following information. The following ...
Text Solution
|
- Answer the question based on the following information. The following ...
Text Solution
|
- A marketing company conducted a survey among 10,000 person in Kanpur :...
Text Solution
|
- A marketing company conducted a survey among 10,000 person in Kanpur :...
Text Solution
|
- Simplify:- 26 * 451 - ? = 5109
Text Solution
|
- Simplify:- 1/4th of 1/2th of 3/4th of 52000 = ?
Text Solution
|
- A table below shows the production and imports of circle oil (in '000 ...
Text Solution
|