


Similar Questions
Explore conceptually related problems
Recommended Questions
- A car is moving on a straight road. The velocity of the car varies wit...
Text Solution
|
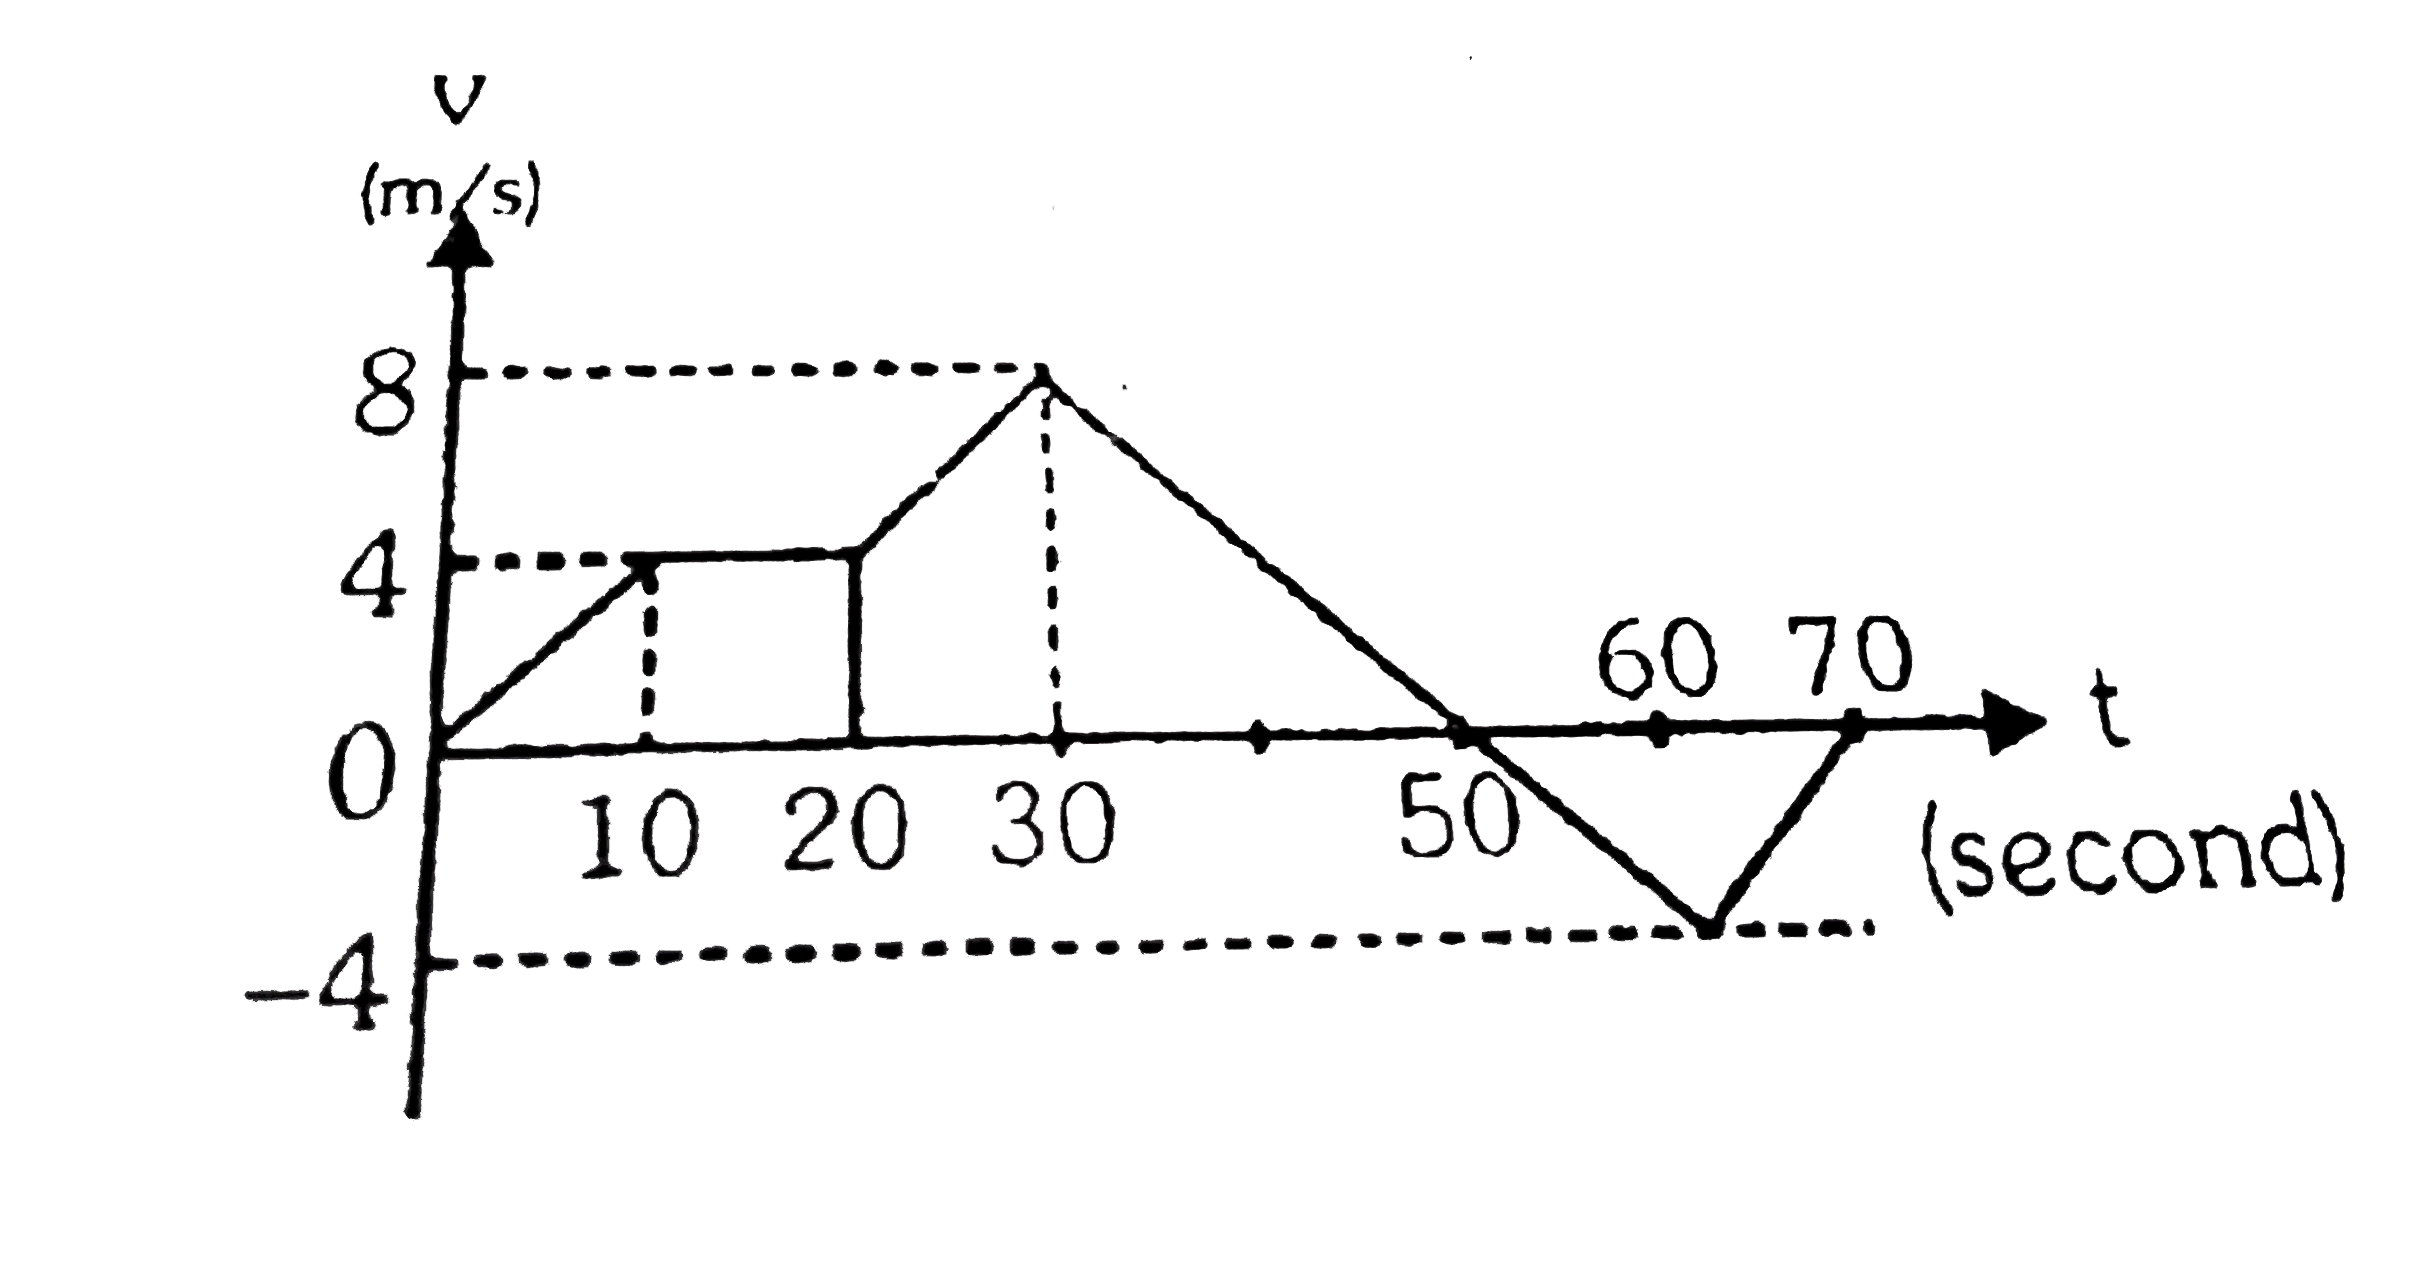
- The velocity-time graph of a car moving along a straight road is shown...
Text Solution
|
- A car is moving on a straight road. The velocity of the car varies wit...
Text Solution
|
- A car is moving on a straight road. The velocity of the car varies wit...
Text Solution
|
- A car is moving on a straight road. The velocity of the car varies wit...
Text Solution
|
- A car is moving on a straight road. The velocity of the car varies wit...
Text Solution
|
- A car is moving on a straight road. The velocity of the car varies wit...
Text Solution
|
- The velocity-time graph of a car moving along a straight road is shown...
Text Solution
|
- The x-t plot of a car is shown in the figure. The average velocity is ...
Text Solution
|