Text Solution
Verified by Experts


Topper's Solved these Questions
PLANT GROWTH AND DEVELOPMENT
MODERN PUBLICATION|Exercise NCERT FILE (NCERT EXEMPLAR PROBLEM (C.SHORT ANSWER TYPE QUESTIONS ))|20 VideosPLANT GROWTH AND DEVELOPMENT
MODERN PUBLICATION|Exercise NCERT FILE (NCERT EXEMPLAR PROBLEM (D.LONG ANSWER TYPE QUESTIONS ))|3 VideosPLANT GROWTH AND DEVELOPMENT
MODERN PUBLICATION|Exercise NCERT FILE (NCERT EXEMPLAR PROBLEM (A. MULTIPLE CHOICE QUESTIONS ))|12 VideosPHOTOSYNTHESIS IN HIGHER PLANTS
MODERN PUBLICATION|Exercise CHAPTER PRACTICE TEST|9 VideosPLANT KINGDOM
MODERN PUBLICATION|Exercise Chapter Practice Test|16 Videos
Similar Questions
Explore conceptually related problems
MODERN PUBLICATION-PLANT GROWTH AND DEVELOPMENT-NCERT FILE (NCERT EXEMPLAR PROBLEM (B. VERY SHORT ANSWER TYPE QUESTIONS ))
- Fill in the places with appropriate word/ words. (a)A phase of grow...
Text Solution
|
- Plant growth substancees (PGS) have innumerable practical applications...
Text Solution
|
- A primary root grows from 5 cm to 19 cm in a weak. Calculate the actua...
Text Solution
|
- Gibberellins were first discovered in japan when rice plants were suff...
Text Solution
|
- Gibberllins promote the formation of ….. Flowers on gnetically plants ...
Text Solution
|
- Classify the following plants into Long-Day Plants (LDP), Short Day Pl...
Text Solution
|
- A farmer grows cucumber plants in his field. He wants to increase the ...
Text Solution
|
- Where are the following hormones synthesised in plants? (a)IAA ,(b)...
Text Solution
|
- In botanical gardens and tea gardens, gardeners trim the plants regula...
Text Solution
|
- Ligh plays an improtant role in the life of all organisms .Name any th...
Text Solution
|
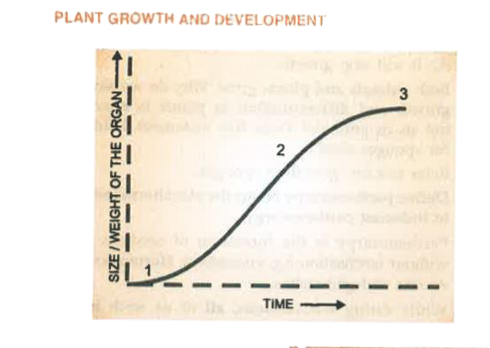
- In the figure of Sigmoid growth curve given below, label segments 1, 2...
Text Solution
|
- Growth is one of the characteristeic of all living organism? Do unicel...
Text Solution
|
- The rice seedlings infected with fungus Gibberella fujikuroi is called...
Text Solution
|