Text Solution
Verified by Experts


Topper's Solved these Questions
OSCILLATIONS
MODERN PUBLICATION|Exercise NCERT Exemplar Problems Subjective Question ( short Answer Type Questions )|6 VideosOSCILLATIONS
MODERN PUBLICATION|Exercise HOTS (Higher Order Thinking Skills & Advanced Level)|11 VideosOSCILLATIONS
MODERN PUBLICATION|Exercise NCERT Exemplar Problems Subjective Question (Multiple Choice Questions (Type-II))|7 VideosMOTION IN A STRAIGHT LINE
MODERN PUBLICATION|Exercise CHAPTER PRACTICE TEST|16 VideosPHYSICAL WORLD
MODERN PUBLICATION|Exercise Revision exercises (Long answer questions)|6 Videos
Similar Questions
Explore conceptually related problems
MODERN PUBLICATION-OSCILLATIONS -NCERT Exemplar Problems Subjective Question (Very short Answer Type Questions )
- Displacement versus time curve for a particle executing S.H.M. is show...
Text Solution
|
- Two identical springs of spring constant k are attached to a block of ...
Text Solution
|
- What are the two basic characteristics of a simple harmonic motion?
Text Solution
|
- When will the motion of a simple pendulum be simple harmonic?
Text Solution
|
- What is the ratio of maximum acceleration to the maximum velocity of a...
Text Solution
|
- What is the ratio between the distance travelled by the oscillator in ...
Text Solution
|
- In figure, what be the sign of the velocity of the point P', which is ...
Text Solution
|
- Show that for a particle executing S.H.M., velocity and displacement h...
Text Solution
|
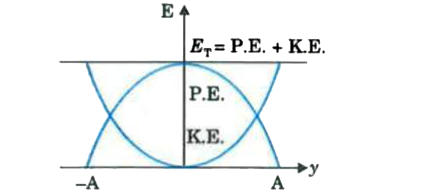
- Draw a graph to show the the variation of P.E., K.E. and total eneryg ...
Text Solution
|
- The length of a second's pendulum on the surface of earth is 1 m. What...
Text Solution
|