
Text Solution
Verified by Experts


Topper's Solved these Questions
STATES OF MATTER : GASES AND LIQUIDS
MODERN PUBLICATION|Exercise NCERT FILE NCERT (EXemplar Problems) (Matching Type Question)|3 VideosSTATES OF MATTER : GASES AND LIQUIDS
MODERN PUBLICATION|Exercise NCERT FILE NCERT (EXemplar Problems) (Assertion and Reason Type Questions)|6 VideosSTATES OF MATTER : GASES AND LIQUIDS
MODERN PUBLICATION|Exercise NCERT FILE (NCERT)(Textbook Exercises)|23 VideosSOME BASIC CONCEPTS OF CHEMISTRY
MODERN PUBLICATION|Exercise COMPETITION FILE (INTEGER TYPE AND NUMERICAL VALUE TYPE QUESTIONS)|10 VideosSTRUCTURE OF ATOM
MODERN PUBLICATION|Exercise Unit Practice Test|13 Videos
Similar Questions
Explore conceptually related problems
MODERN PUBLICATION-STATES OF MATTER : GASES AND LIQUIDS-NCERT FILE NCERT (EXemplar Problems) (Multiple Choice Questions (Type-I))
- Dipole-dipole forces act between the molecules possessing permanent di...
Text Solution
|
- What will be the molar volume of nitrogen and Helium at 273.15K and 1 ...
Text Solution
|
- A gas that follows Boyle's law, Charle's law and Avogadro's law is cal...
Text Solution
|
- Two different gases 'A' and 'B' are filled in separate containers of e...
Text Solution
|
- Value of universal gas constant (R) is same for all gases. What is its...
Text Solution
|
- One of the assumptions of kinetic theory of gases states that "there i...
Text Solution
|
- the magnitude of surface tension of liquid dpends on the attractive fo...
Text Solution
|
- Pressure exerted by saturated water vapour is called aqueous tension. ...
Text Solution
|
- Name the energy which arises due to motion of atoms of molecules in a ...
Text Solution
|
- Name two intermolecular forces that exist between HF molecules in liqu...
Text Solution
|
- One of the assumptions of kineti theory of gases is that there is no f...
Text Solution
|
- Compressibility factor, Z of a gas is given as Z=(pV)/(nRT) (i) What...
Text Solution
|
- The critical temperature (T(c)) and critical pressure (p(c)) of CO(2) ...
Text Solution
|
- For real gases the relation between p, V and T is given by c=van der W...
Text Solution
|
- The relation between pressure exerted by an ideal gas (p("ideal")) and...
Text Solution
|
- Name two phenomena that can be explained on the basis of surface tensi...
Text Solution
|
- Viscosity of a liquid arises due to strong intermolecular forces exist...
Text Solution
|
- Explain the effect of increasing the temperature of a liquid, on inter...
Text Solution
|
- The variation of pressure with volume of the gas at different temperat...
Text Solution
|
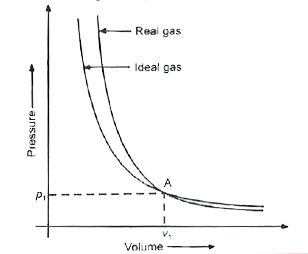
- Pressure versus volume graph for real gas and are shown in figure. Ans...
Text Solution
|