


Similar Questions
Explore conceptually related problems
Recommended Questions
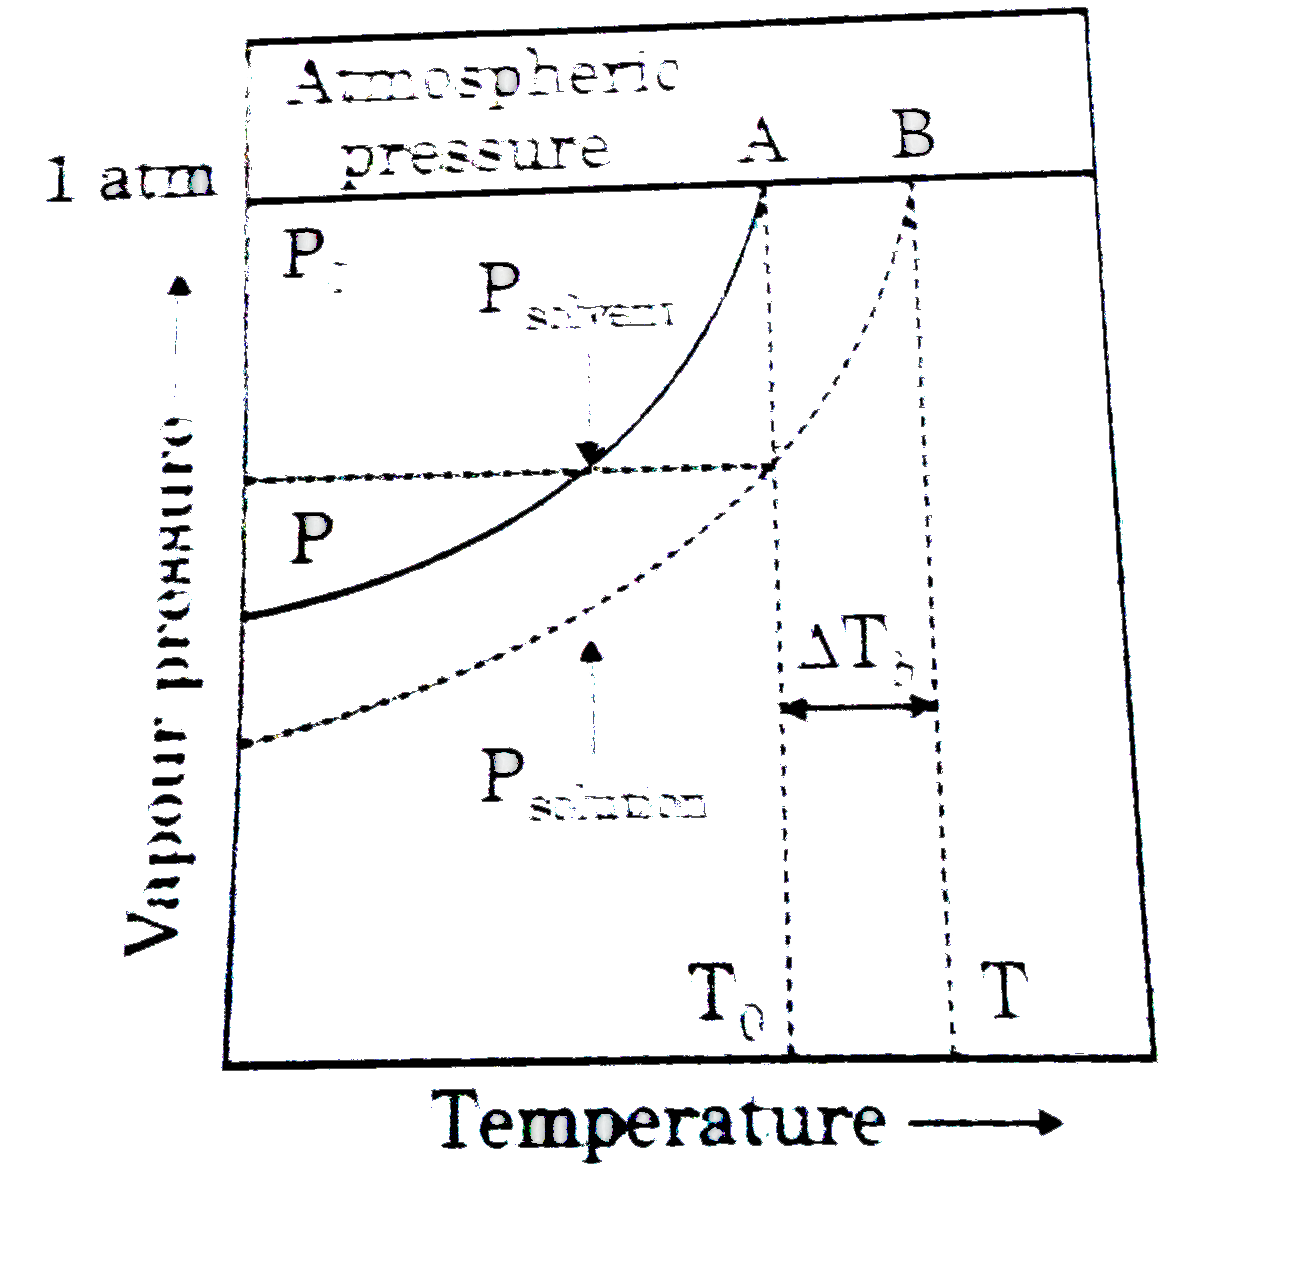
- Figure explains elevation in boiling point when a non-volatile solute ...
Text Solution
|
- Figure explains elevation in boiling point when a non-volatile solute ...
Text Solution
|
- Figure explains elevation in boiling point when a non-volatile solute ...
Text Solution
|
- Why does a solution containing a non-volatile solute have higher boili...
Text Solution
|
- A' gram of non-volatile, non-electrolyte (molar mass M) is dissolved i...
Text Solution
|
- यदि DeltaT(b) क्वथनांक में उन्नयन तथा m विलयन की मोललता को दर्शाता हो ...
Text Solution
|
- If the solution boils at a temperature T1 and solvent at a temperature...
Text Solution
|
- विलेय की मोलल सांद्रता वाले विलयन का क्वथनांक उन्नयन सर्वाधिक होगा यदि...
Text Solution
|
- The molar elevation constant is equal to the elevation in boiling poin...
Text Solution
|