


Similar Questions
Explore conceptually related problems
Recommended Questions
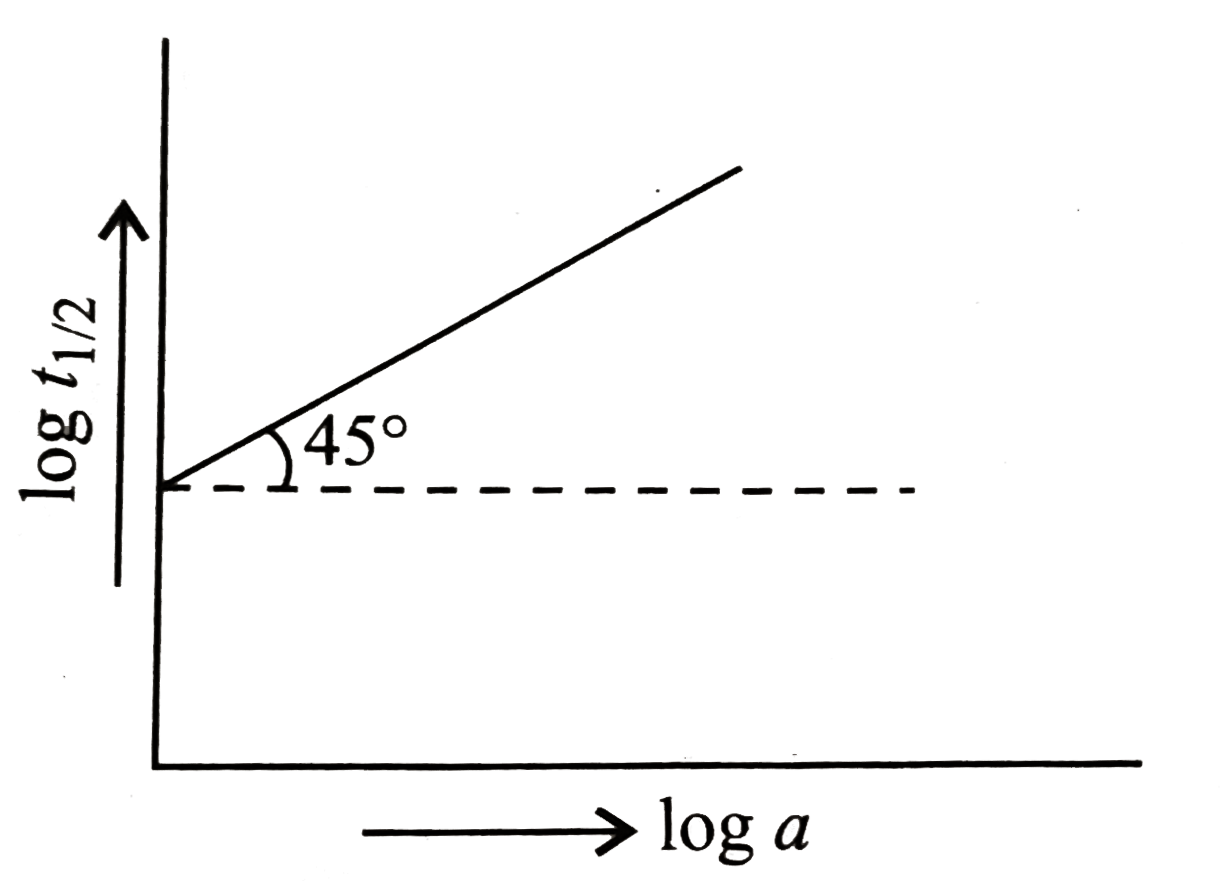
- Following is the graph between log T(50) and log a (a = initial concen...
Text Solution
|
- Following is the graph between log T(50) and log a ( a = initial conce...
Text Solution
|
- Following is the graph between log t(1//2) and log a (a initial concen...
Text Solution
|
- A graph between log t((1)/(2)) and log a (abscissa), a being the initi...
Text Solution
|
- Following is the graph between log T(50) and log a (a = initial concen...
Text Solution
|
- A graph plotted between log t(50%) vs log concentration is a straight ...
Text Solution
|
- A graph plotted between log t(50) vs log concentration is a straight l...
Text Solution
|
- A graph between log t((1)/(2)) and log a (abscissa), a being the init...
Text Solution
|
- A graph between log t(1//2) and log a (abscissa), a being the initial ...
Text Solution
|