


Similar Questions
Explore conceptually related problems
Recommended Questions
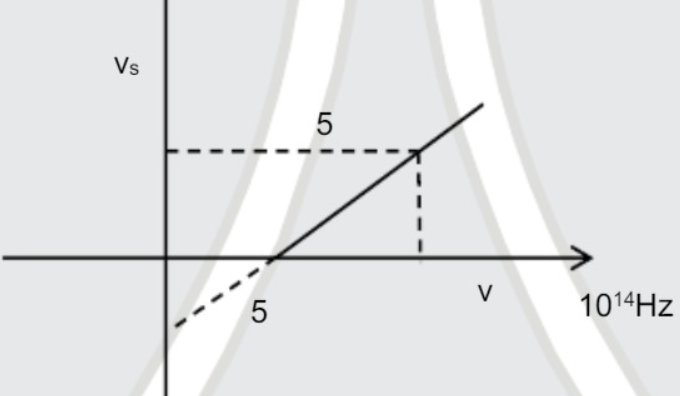
- Graph between stopping potential and frequency of light as shown find ...
Text Solution
|
- Graph between stopping potential and frequency of photon is given in f...
Text Solution
|
- The stopping potential as a function of the frequency of the incident ...
Text Solution
|
- From the graph shown, the value of work function if the stopping poten...
Text Solution
|
- Choose the correct option for the graph between the frequency of incid...
Text Solution
|
- The following figure shows a graph for the stopping potential as a fun...
Text Solution
|
- In photoelectric effect the slope of straight line graph between stopp...
Text Solution
|
- The stopping potential as a function of frequency of incident radiatio...
Text Solution
|
- Choose the graph showing the correct relationship between the stopping...
Text Solution
|