Text Solution
Verified by Experts


Topper's Solved these Questions
Similar Questions
Explore conceptually related problems
NCERT-DATA HANDLING-EXERCISE 9.4
- Number of persons in various age groups in a town is given in the fol...
Text Solution
|
- The number of Mathematics books sold by a shopkeeper on six consecutiv...
Text Solution
|
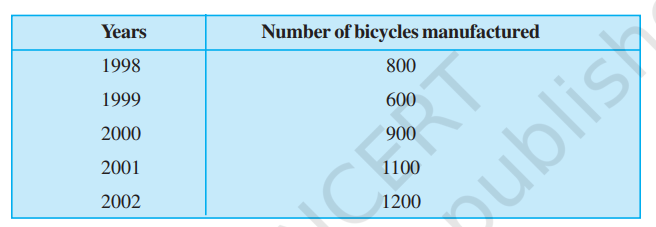
- Following table shows the number of bicycles manufactured in a factory...
Text Solution
|
- A survey of 120 school students was done to find which activity they ...
Text Solution
|