Text Solution
Verified by Experts


Topper's Solved these Questions
Similar Questions
Explore conceptually related problems
NCERT-DATA HANDLING-SOLVED EXAMPLES
- Following table shows the monthly expenditure of Imran’s familyon var...
Text Solution
|
- Following is the pictograph of the number of wrist watches manufacture...
Text Solution
|
- The colours of fridges preferred by people living in a locality are sh...
Text Solution
|
- A survey was carried out on 30 students of class VI in a school. Data...
Text Solution
|
- Ekta is asked to collect data for size of shoes of students in her Cl...
Text Solution
|
- The following pictograph shows the number of absentees in aclass of 30...
Text Solution
|
- A teacher wants to know the choice of food of each student aspart of t...
Text Solution
|
- The following are the number of electric bulbs purchased for alodging ...
Text Solution
|
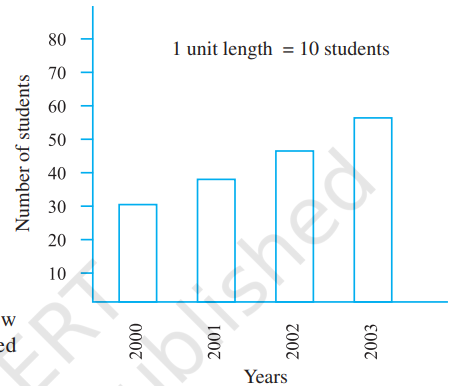
- Read the adjoining bar graph showing the number ofstudents in a partic...
Text Solution
|