


Similar Questions
Explore conceptually related problems
Recommended Questions
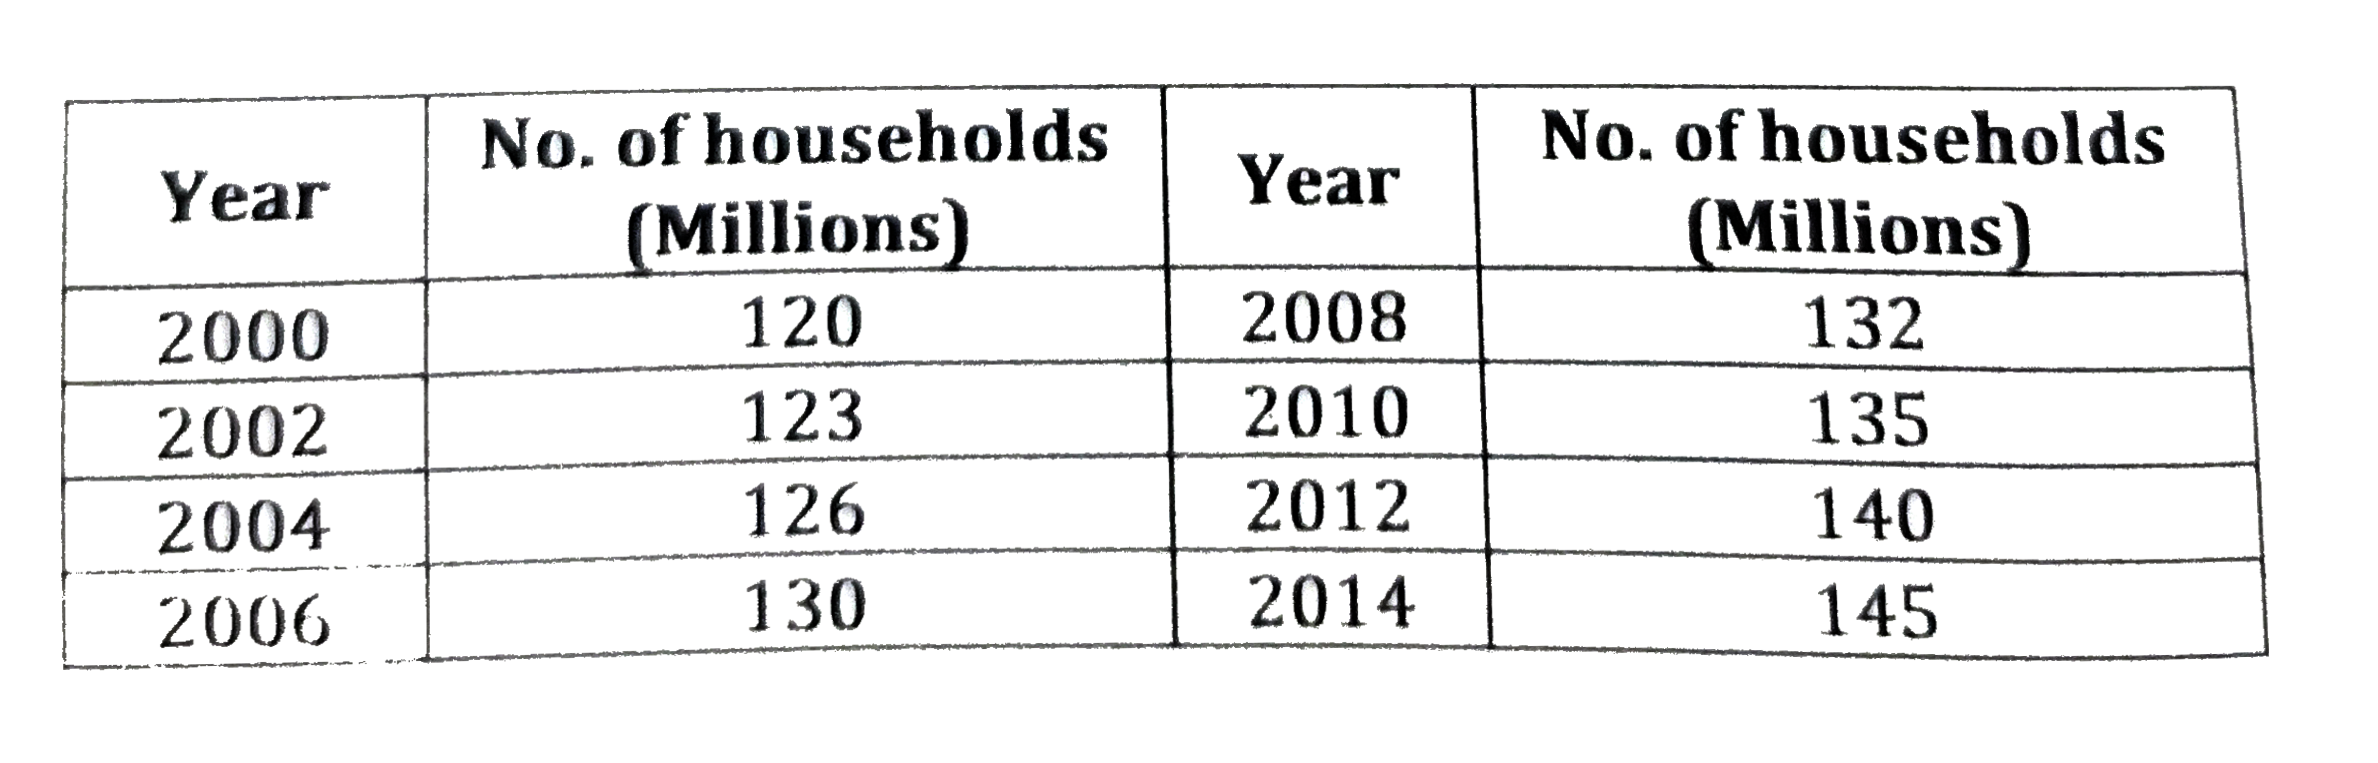
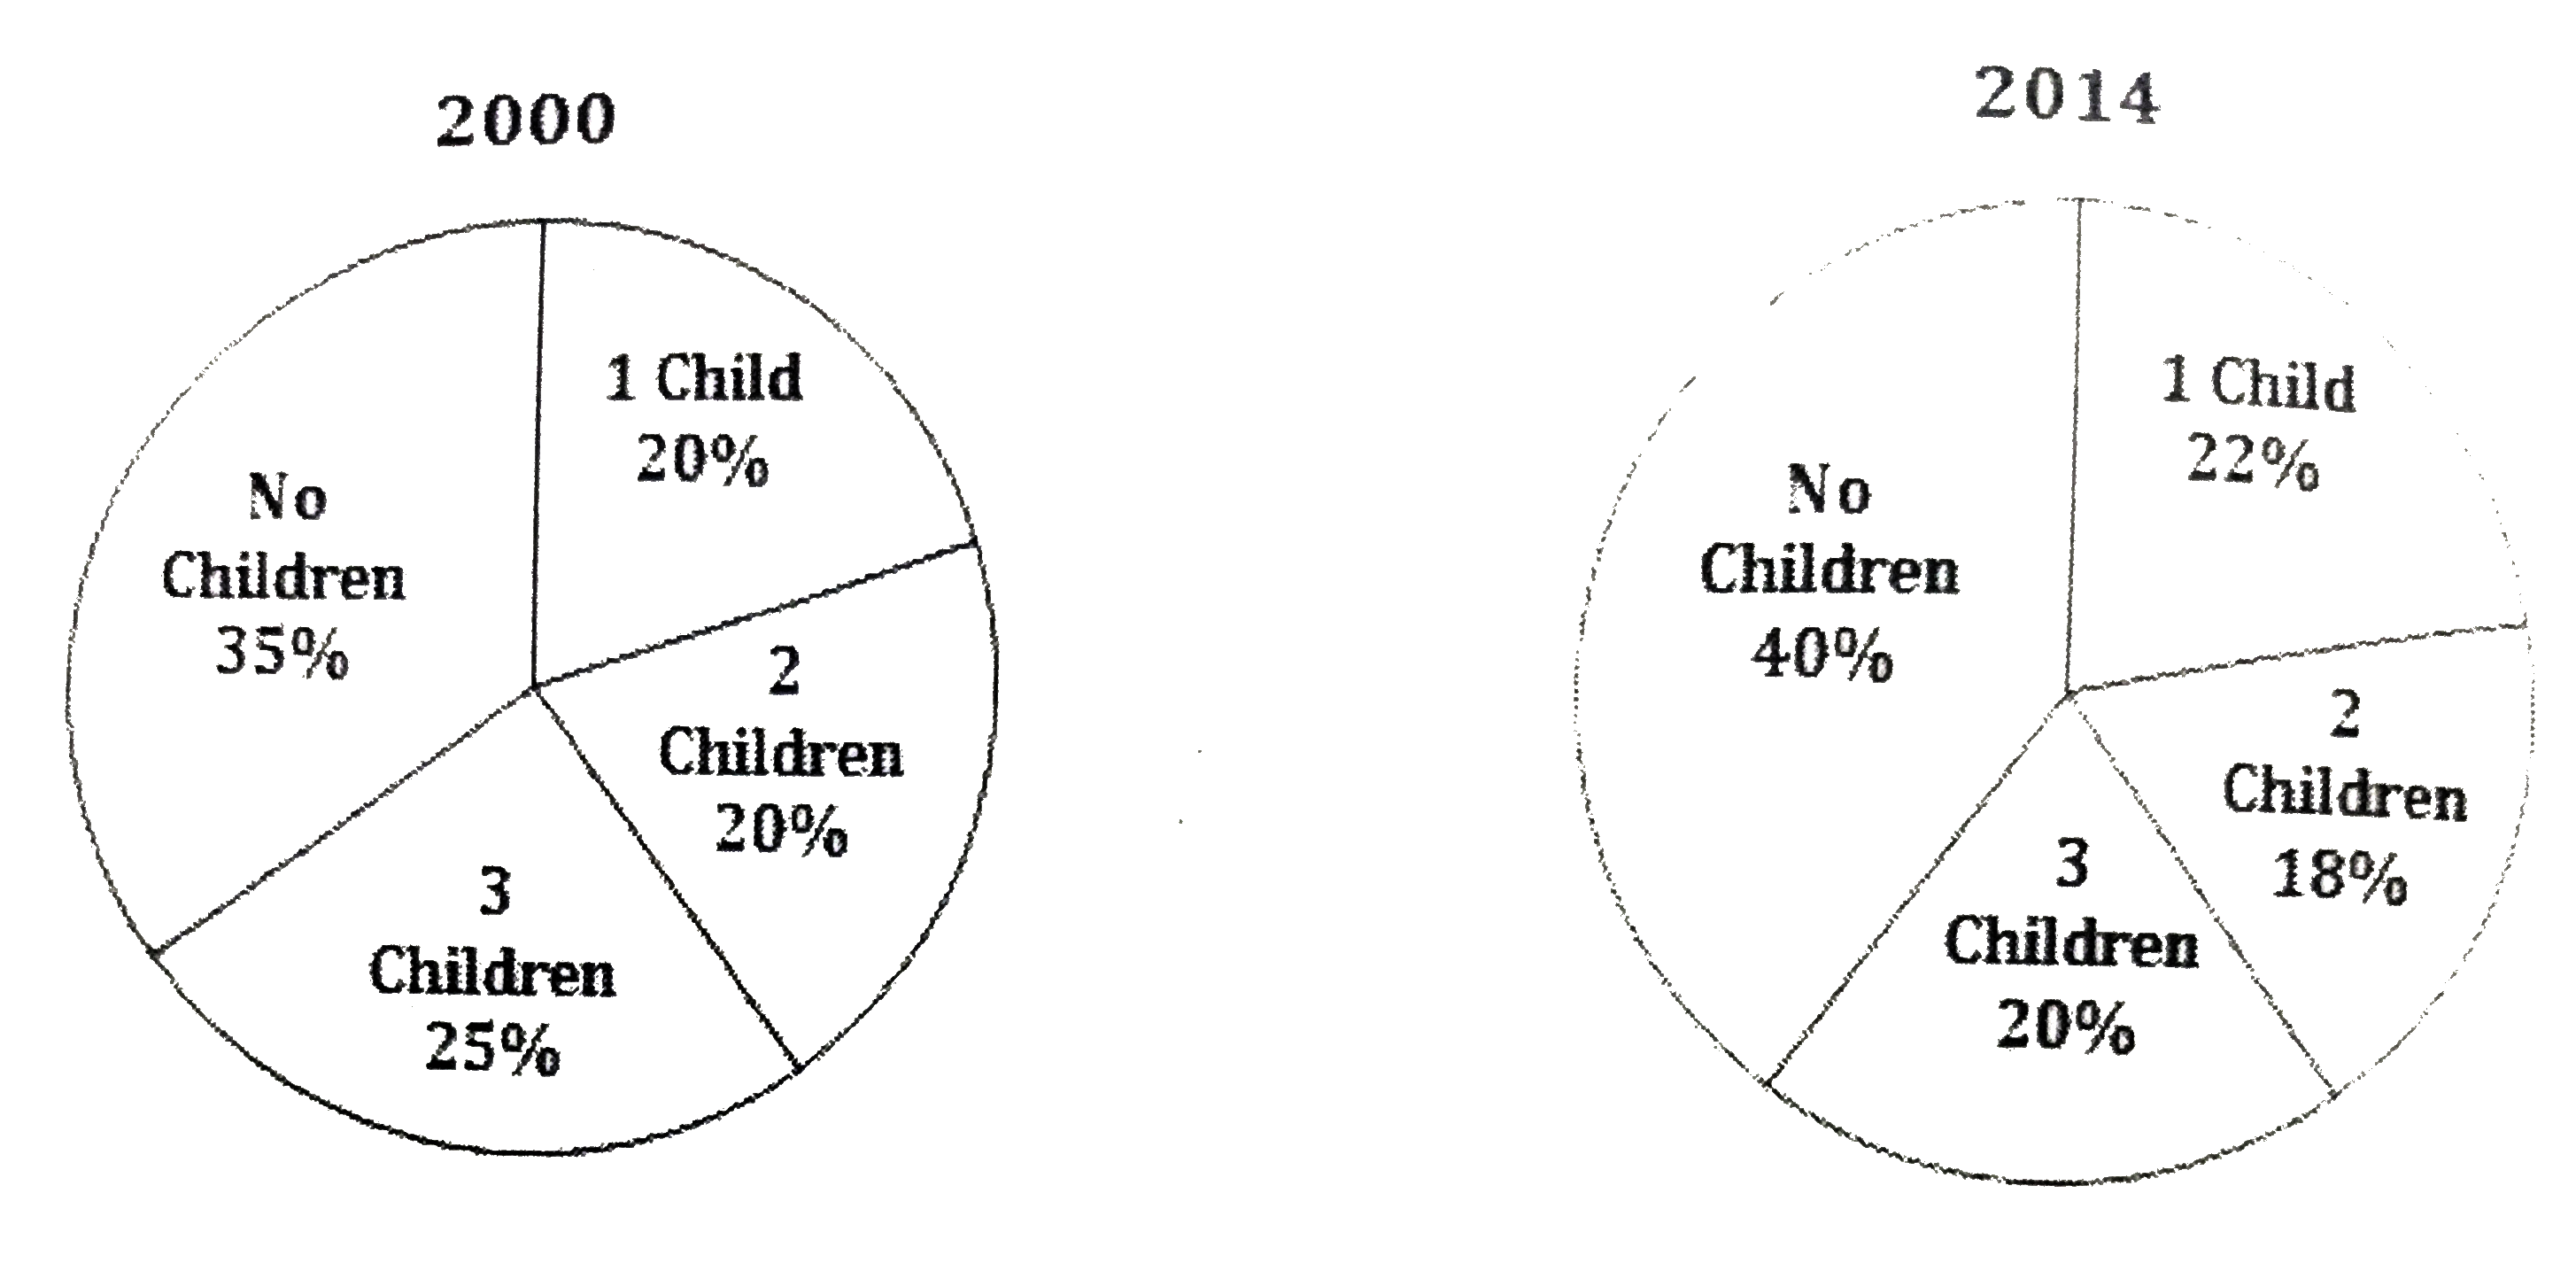
- The following table gives the number of households in USA during ...
Text Solution
|
- Calculate the cost of living index for the year 2006 taking 1990 as th...
Text Solution
|
- From the following data, using weighted average method, calculate the ...
Text Solution
|
- The cost of living index for the year 2007 considering the base year a...
Text Solution
|
- Find the cost of living index in the year 2007, taking 2001 as the bas...
Text Solution
|
- The cost of living index for the year 2007, considering the year 2000...
Text Solution
|
- Which of the following are correct chain isomers of butane ? (i) <img ...
Text Solution
|
- Determine the point of symmetry of a regular hexagon. <img src="htt...
Text Solution
|
- Dtermine the images of the following figure about the given line : ...
Text Solution
|