Text Solution
Verified by Experts
The correct Answer is:


Topper's Solved these Questions
HEAT AND TEMPERATURE
FIITJEE|Exercise ASSIGNMENT PROBLEMS (SUBJECTIVE) (LEVEL II AND III)|15 VideosHEAT AND TEMPERATURE
FIITJEE|Exercise ASSIGNMENT PROBLEMS (OBJECTIVE) (LEVEL-I)|50 VideosHEAT AND TEMPERATURE
FIITJEE|Exercise ASSIGNMENT PROBLEMS (SUBJECTIVE) (level-1) (FILL IN THE BLANKS)|5 VideosGRAVITATION
FIITJEE|Exercise Numerical based Question|2 VideosKINEMATICS
FIITJEE|Exercise NUMERICAL BASED QUESTIONS DECIMAL TYPE|5 Videos
Similar Questions
Explore conceptually related problems
FIITJEE-HEAT AND TEMPERATURE-ASSIGNMENT PROBLEMS (SUBJECTIVE) (level-1) (TRUE OR FALSE QUESTIONS)
- Isothermal and adiabatic process are identical.
Text Solution
|
- At a given temperature, the specific heat of a gas at constant pressur...
Text Solution
|
- The ratio of the specific heat at constant pressure to that at constan...
Text Solution
|
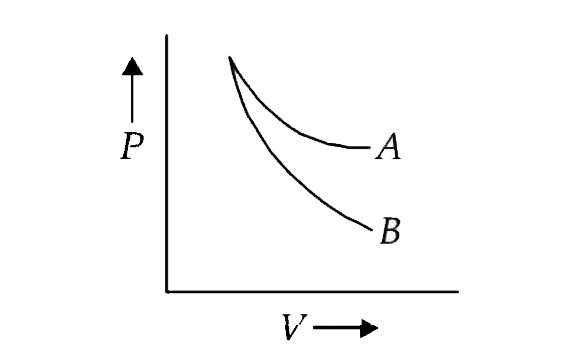
- The curves A and B in the figure shown P-V graphs for an isothermal an...
Text Solution
|
- Total internal energy of an ideal gas remains constant in isothermal p...
Text Solution
|
- During isobaric expansion number of collisioins of gaseous molecules w...
Text Solution
|