Home
Class 11
PHYSICS
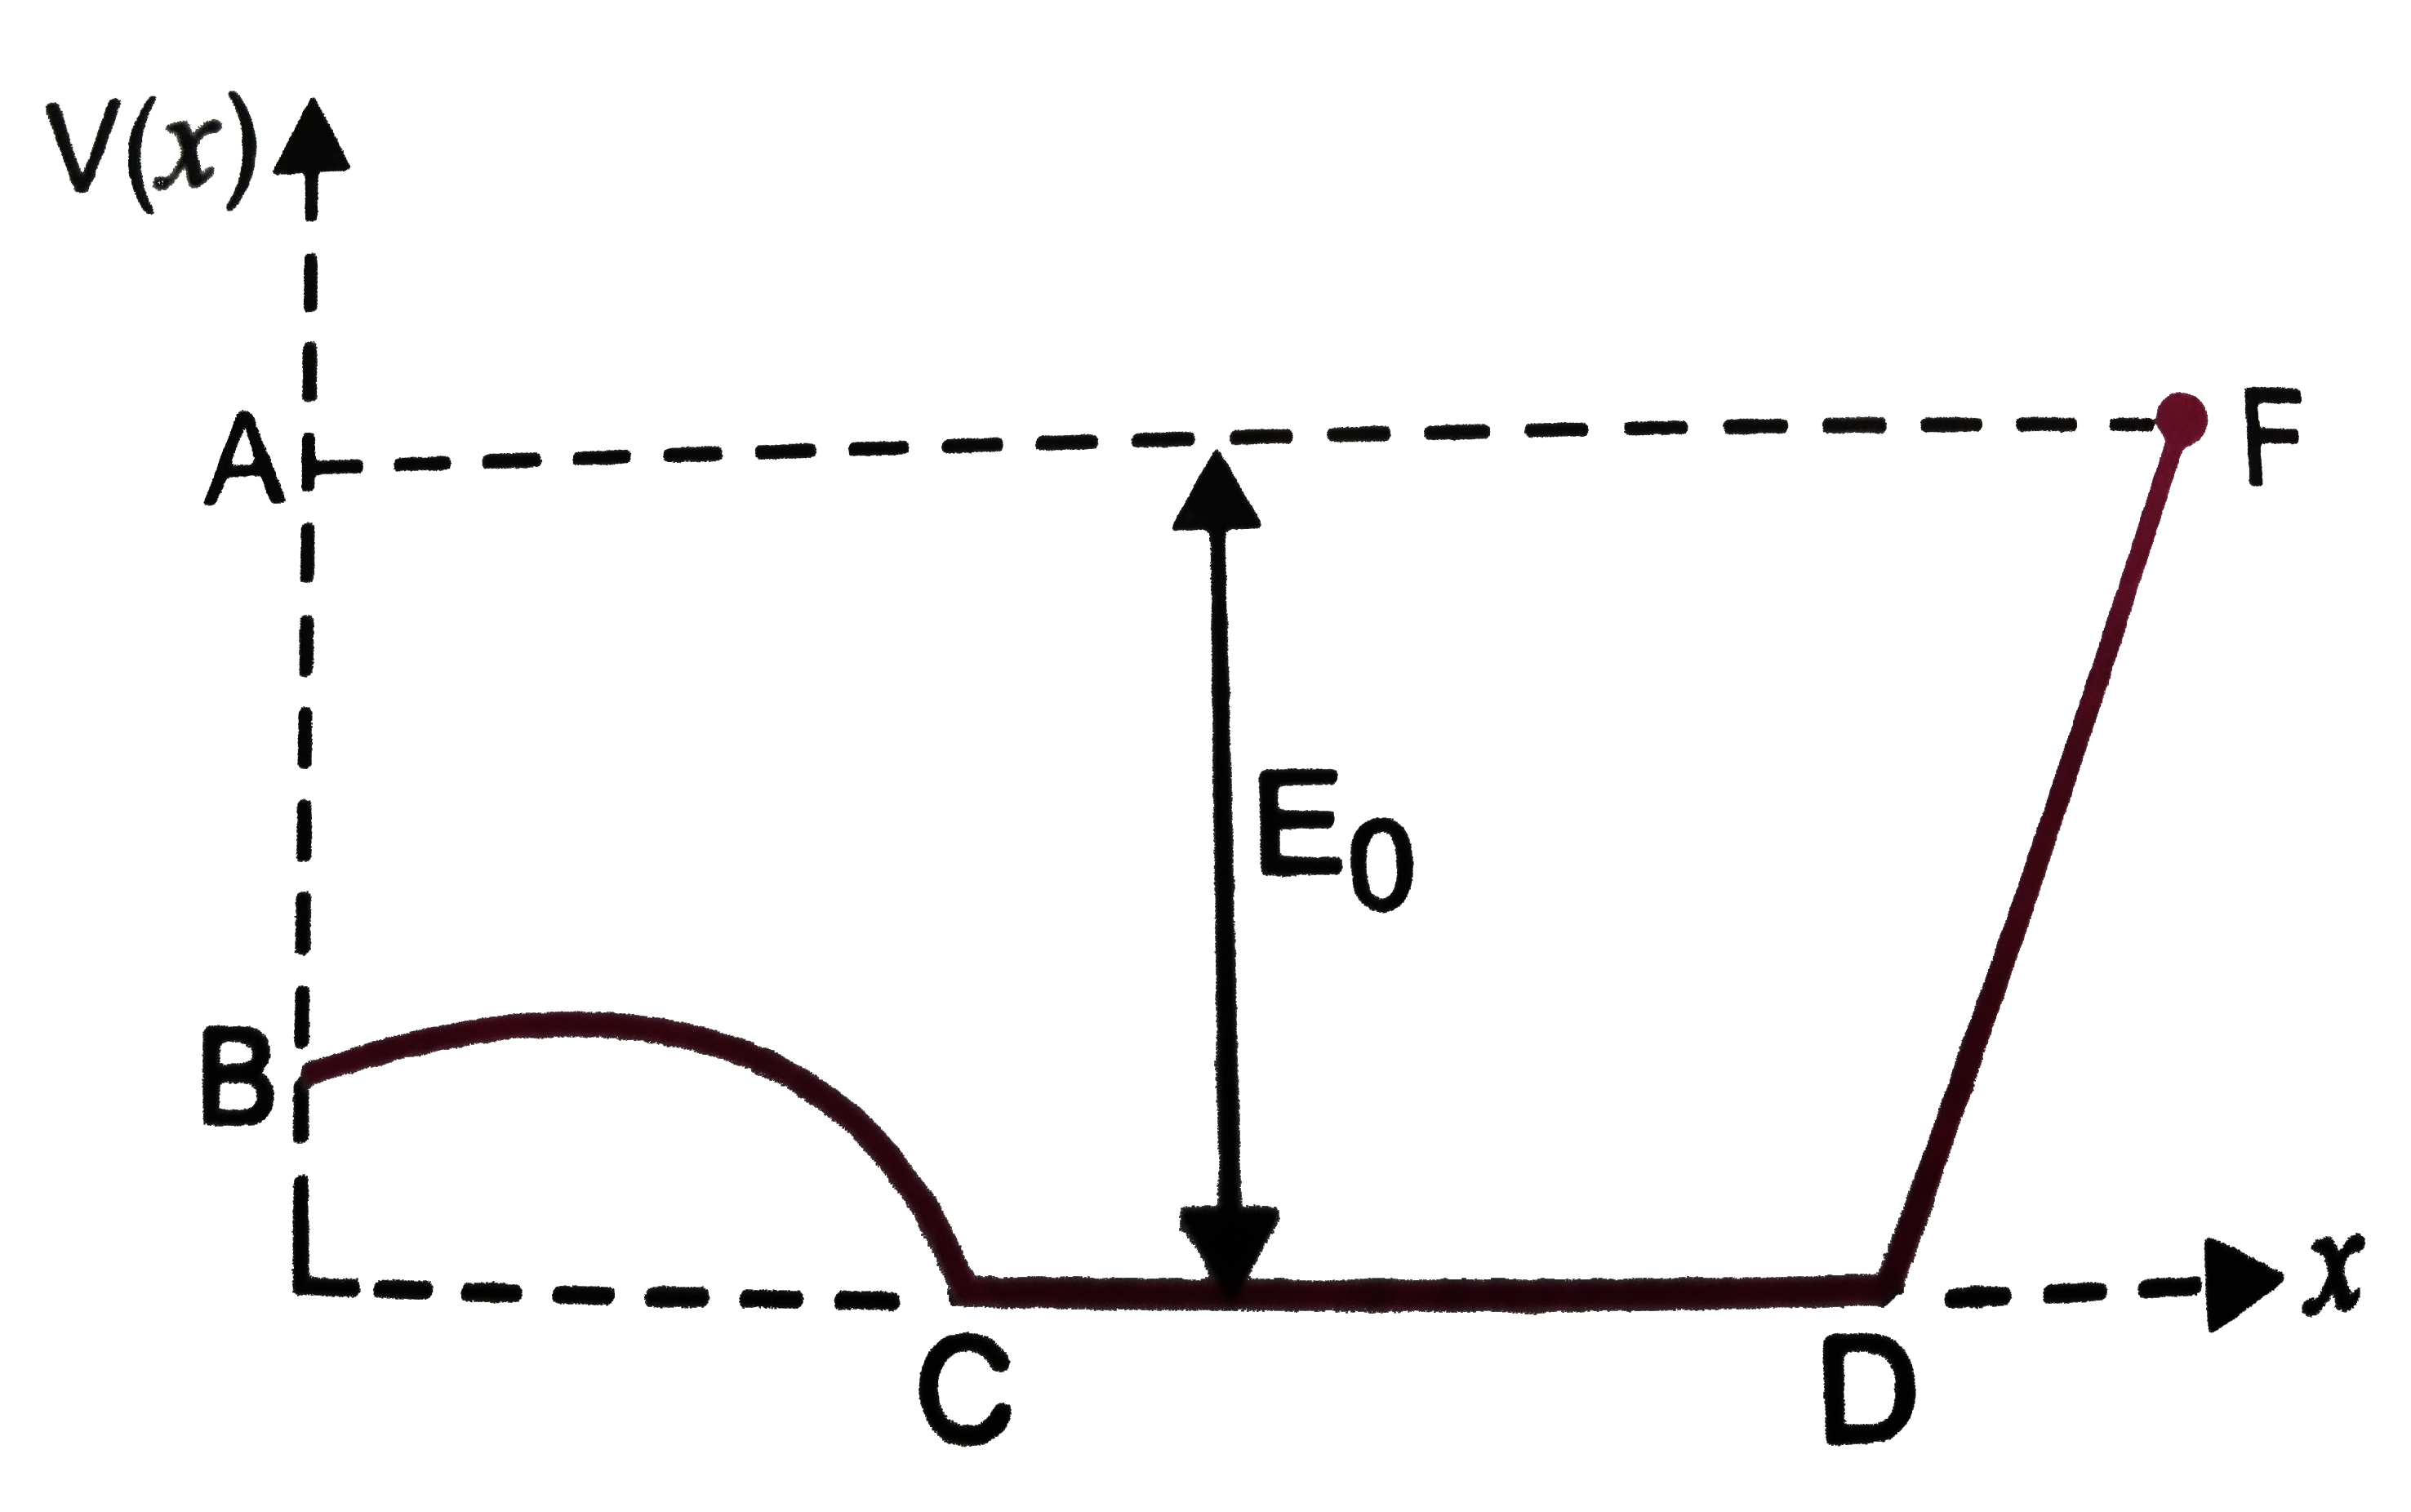
A graph of potential energy V(x) verses ...

A graph of potential energy `V(x)` verses x is shown in figure. A particle of energy `E_(0)` is executing motion in it. Draw graph of velocity and kinetic energy versus x for one complete cycle AFA.

Text Solution

Verified by Experts

Total energy `E_(0) = KE +PE`
or `E_(0) = KE +V(x)`
or `KE = E_(0) - V(x)`
At A , `V(x) = E_(0) `and KE = 0 , so v = 0
Figures (a) and (b) show the graph of velocity and KE versus x for complete cycle AFA .

At B ,`V(x) lt E_(0)` and KE is positive but not maximu
At C and D , V(x) = 0 and KE = maximum ,
` v = pm ` maximum
At F , `V(x) =E_(0) `and KE = 0 , so v = 0
Figures (a) and (b) show the graph of velocity and KE versus x for one complete cycle AFA .
Doubtnut Promotions Banner Mobile Dark
|

Topper's Solved these Questions

  • WORK, ENERGY AND POWER

    MODERN PUBLICATION|Exercise Higher Order Thinking Skills & Advanced Level|15 Videos
  • WORK, ENERGY AND POWER

    MODERN PUBLICATION|Exercise Revision Exercise (Very Short Answer Questions)|31 Videos
  • WORK, ENERGY AND POWER

    MODERN PUBLICATION|Exercise NCERT FILE (NCERT Exemplar Problems (Very Short Answer Type Questions))|12 Videos
  • WAVES

    MODERN PUBLICATION|Exercise CHAPTER PRACTICE TEST|14 Videos

Similar Questions

Explore conceptually related problems

Draw the graph between displacement and kinetic energy for a particle executing SHM.

Assertion : The graph of potential energy and kinetic energy of a particle in SHM with respect to position is a parabola. Reason : Potential energy and kinetic energy do not vary linearly with position.

Knowledge Check

  • The potential energy function for a particle executing linear SHM is given by V(x)= 1/2kx^2 where k is the force constant of the oscillator. For k = 0.5 Nm^(-1) , the graph of V(x) versus x is shown in the figure A particle of total energy E turns back when it reaches x=pmx_m .if V and K indicate the potential energy and kinetic energy respectively of the particle at x= +x_m ,then which of the following is correct?

    A
    V=0, K=E
    B
    V=E, K=0
    C
    V lt K, K=0
    D
    V=0, K lt E
  • The slope of potential energy versus position graph represents

    A
    force
    B
    power
    C
    momentum
    D
    work
  • The figure below shows a graph of potential energy U(s) verses position x for a particle executing on edimensional motion along the x axis. The total mechanical energy of the system is indicated by the dashed line. At t=0 the particle is somewhere between points A and G. For later times choose the correct statement:-

    A
    The magnitude of force is maximum at D
    B
    The kinetic energy is maximum at B
    C
    The velocity is zero at A `&` G
    D
    The magnitude of force is minimum at F
  • Similar Questions

    Explore conceptually related problems

    If v, pand E denote the velocity, momentum and kinetic energy of the particle, then

    Asserton: y-x graph of a transverse wave on a string is as shown in figuer. At potential energy and kinetic energy both are minimum. Reason : At point B kinetic energy and ptential energy both are maximum.

    The potential energy U(x) of a particle moving along x- axis is shown in figure. Which one of the following graphs represents the variation of kinetic energy of this particel if its total mechanical enery is E_(0)

    A potential energy curve U(x) is shown in the figure. What value must the mechanical energy E_(mec) of the particle not exceed, if the particle is to be trapped within the region shown in graph? .

    The potential energy of a particle varies with distance x as shown in the graph. The force acting on the particle is zero at