


Similar Questions
Explore conceptually related problems
Recommended Questions
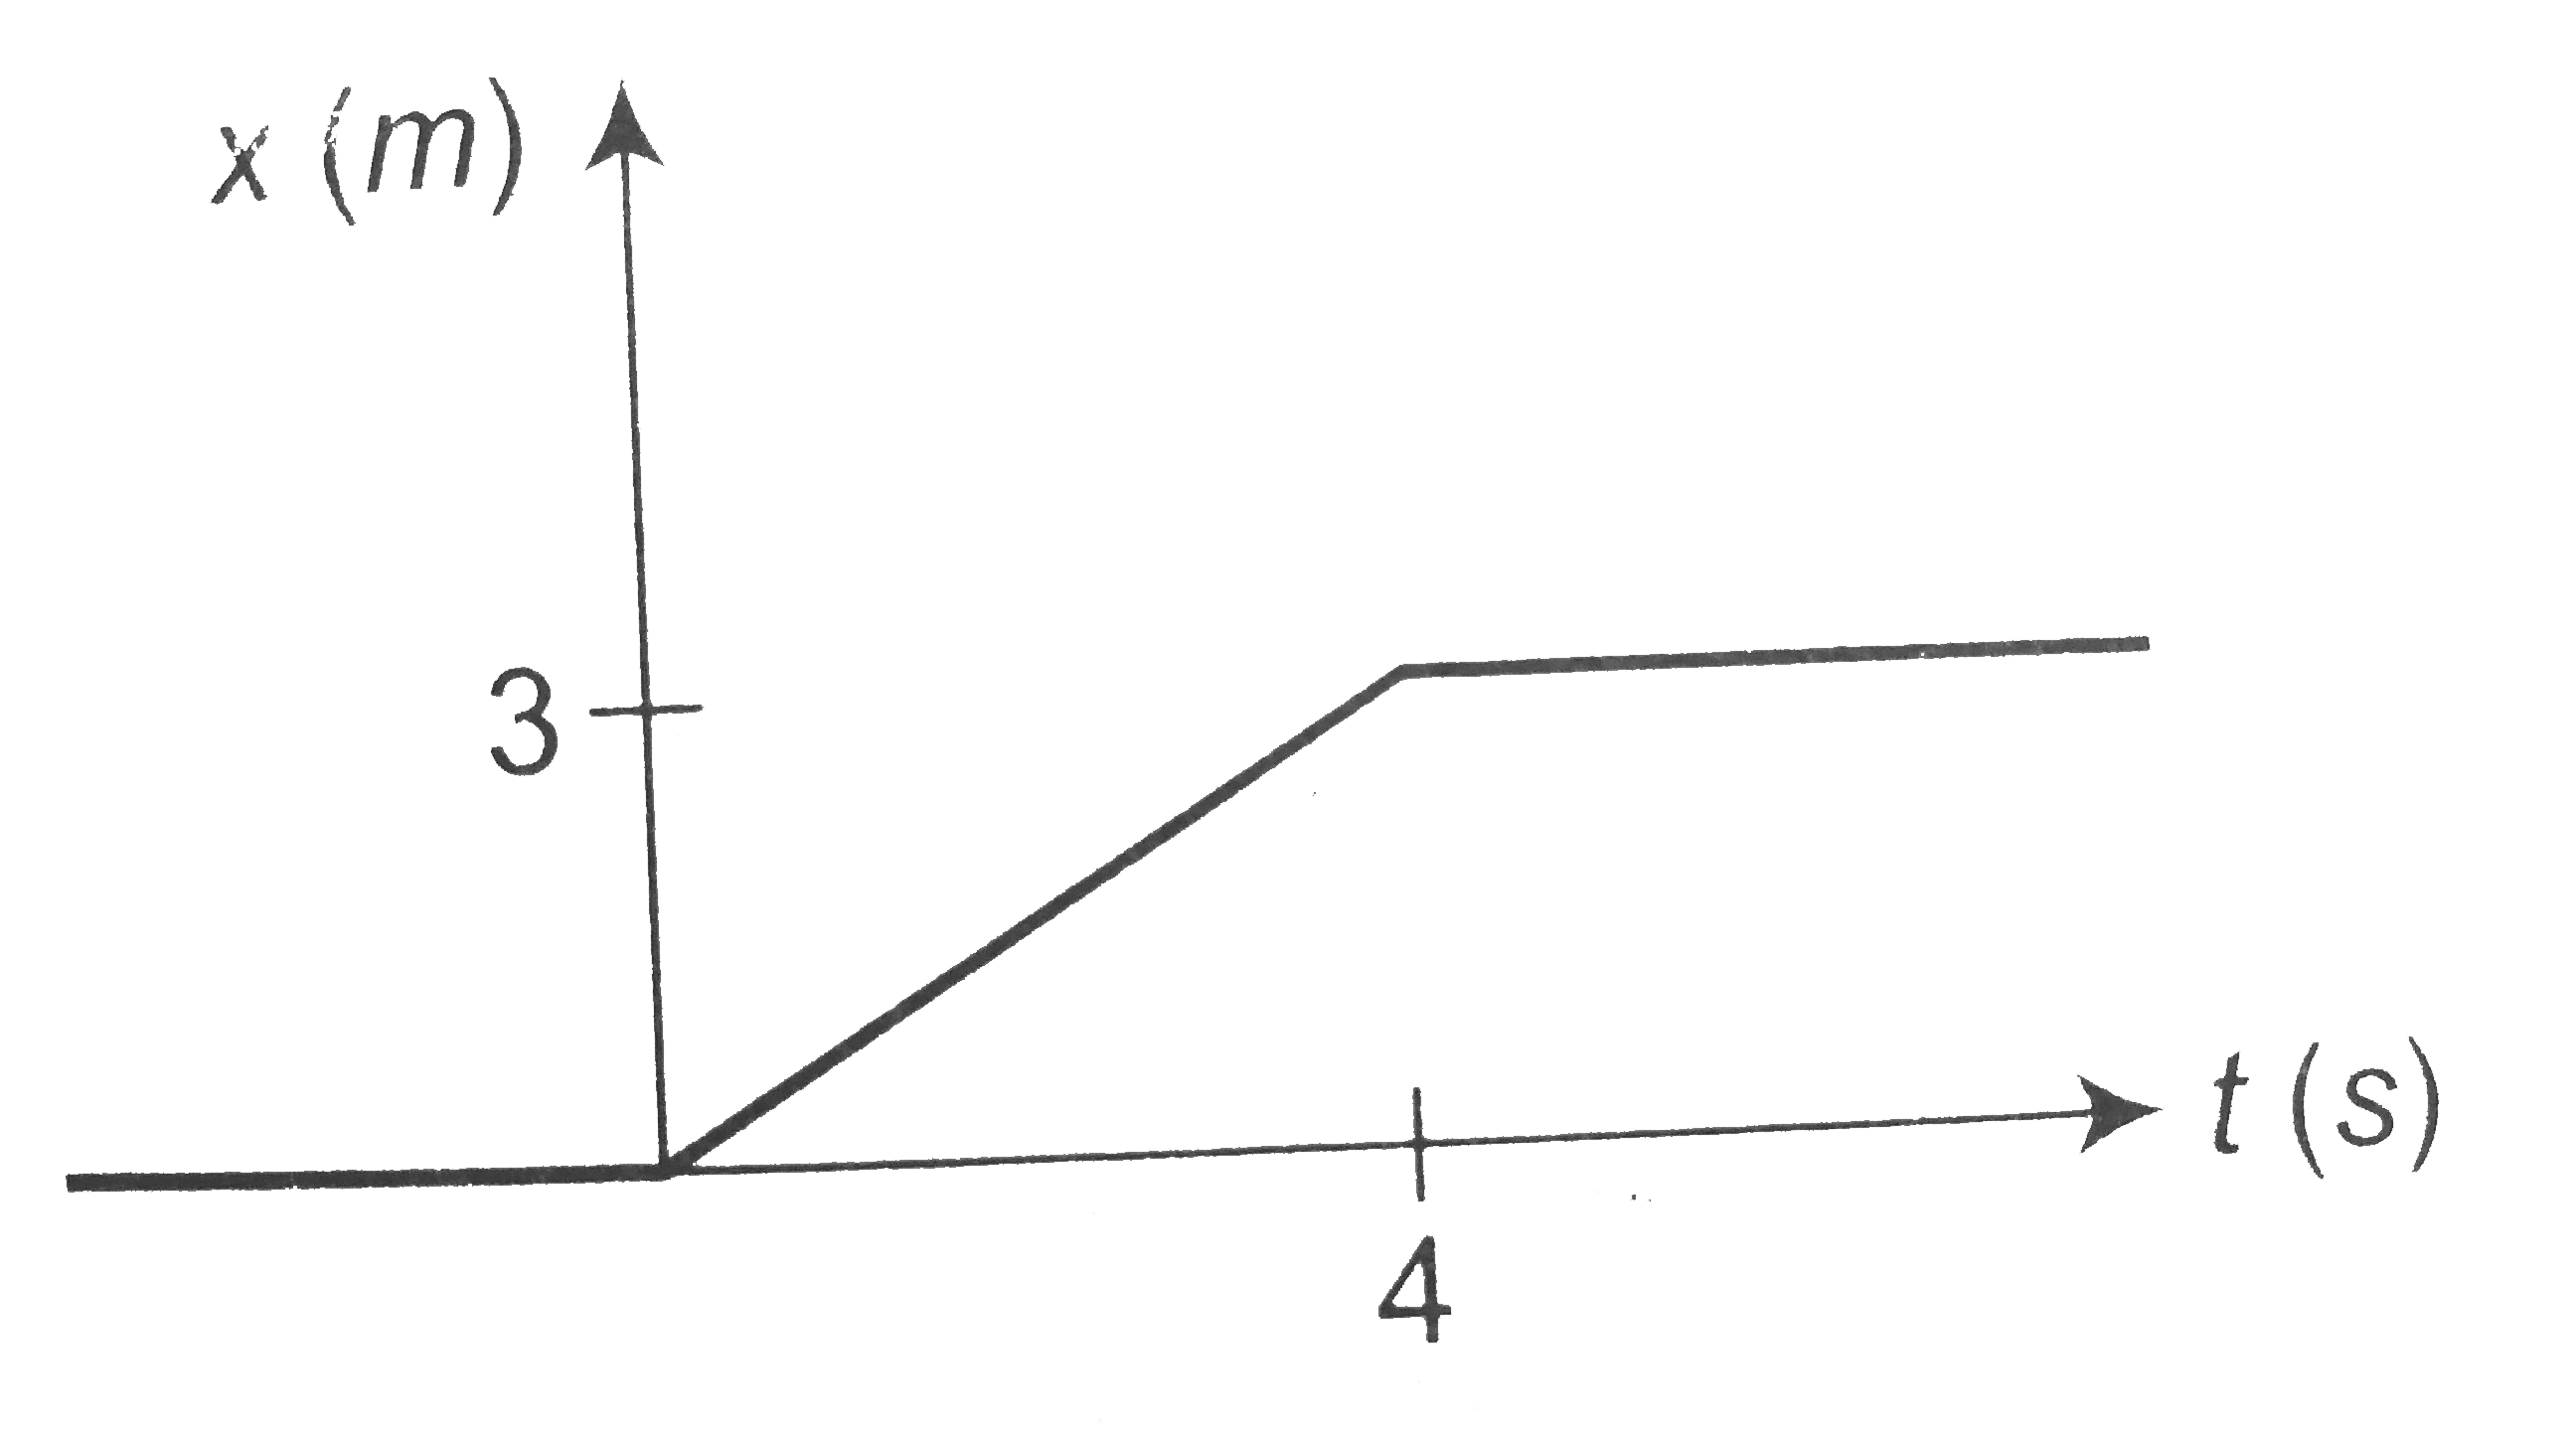
- Figure shows the position-time graph of a particle of mass 4kg. Let th...
Text Solution
|
- When forces F(1) , F(2) , F(3) are acting on a particle of mass m such...
Text Solution
|
- Figure shows the position-time graph of a particle of mass 4kg. Let th...
Text Solution
|
- When force vec(F(1)), vec(F(2)),vec(F(3))"…..."vec(F(n)) act on a part...
Text Solution
|
- बल F(1),F(2) और F(3) एक m द्रव्यमान के कण , पर इस प्रकार कार्य कर रह...
Text Solution
|
- Three force F(1), F(2), F(3) -of which F(2) and F(3) are mutually perp...
Text Solution
|
- Three forces bar(F(1)), bar(F(2)) and bar(F(3)) are simultaneously act...
Text Solution
|
- When forces F(1), F(2), F(3) are acting on a particle of mass m such t...
Text Solution
|
- दिया गया चित्र 4kg द्रव्यमान के किसी कण के स्थिति-समय ग्राफ को दर्शाता...
Text Solution
|