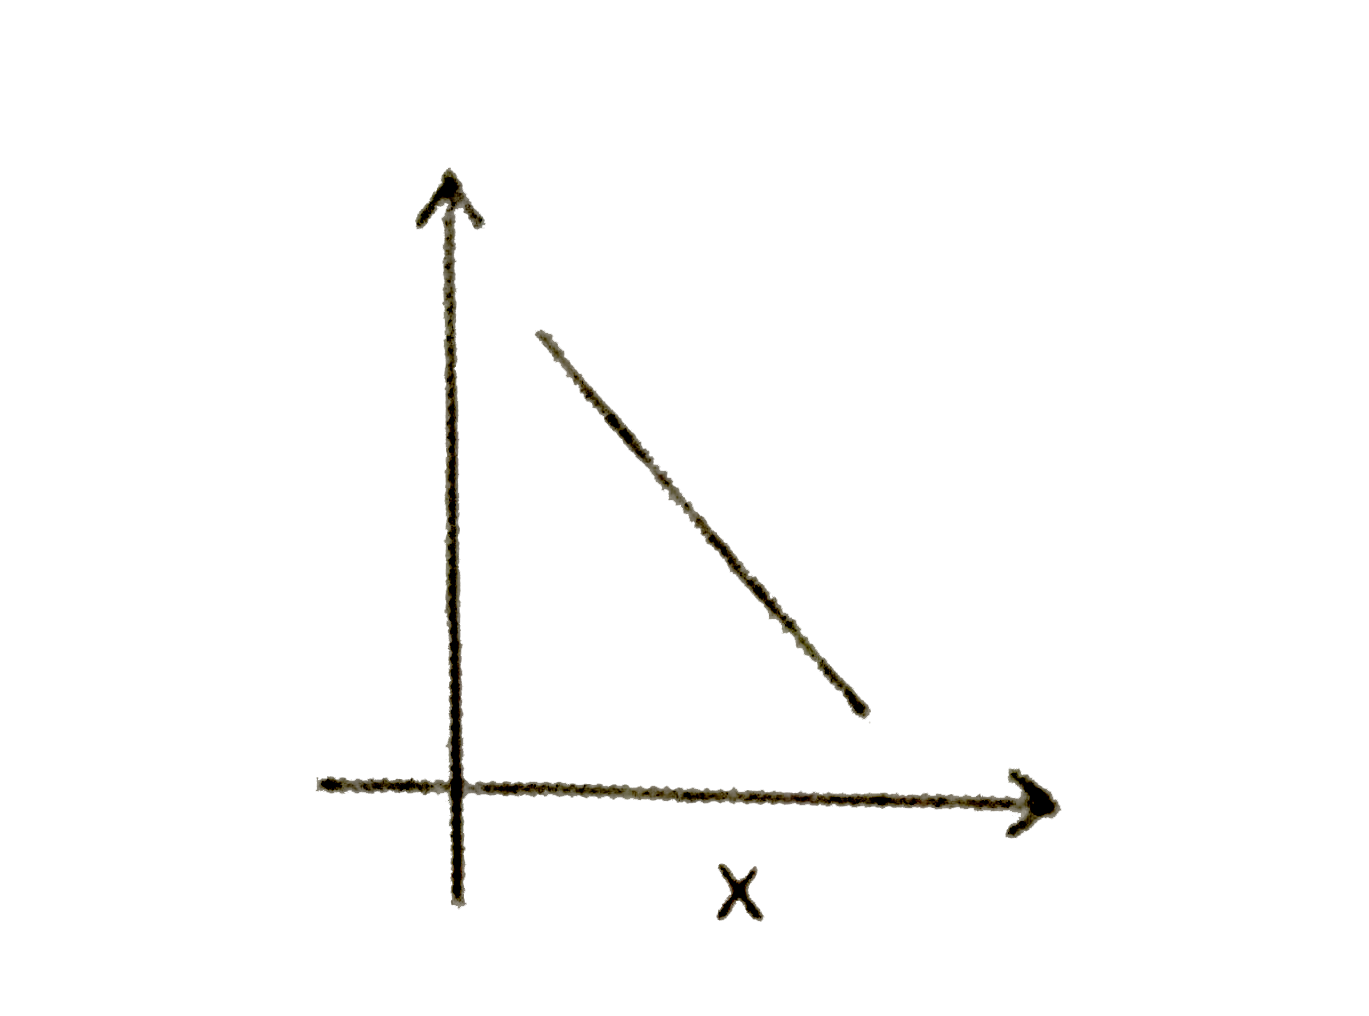
A
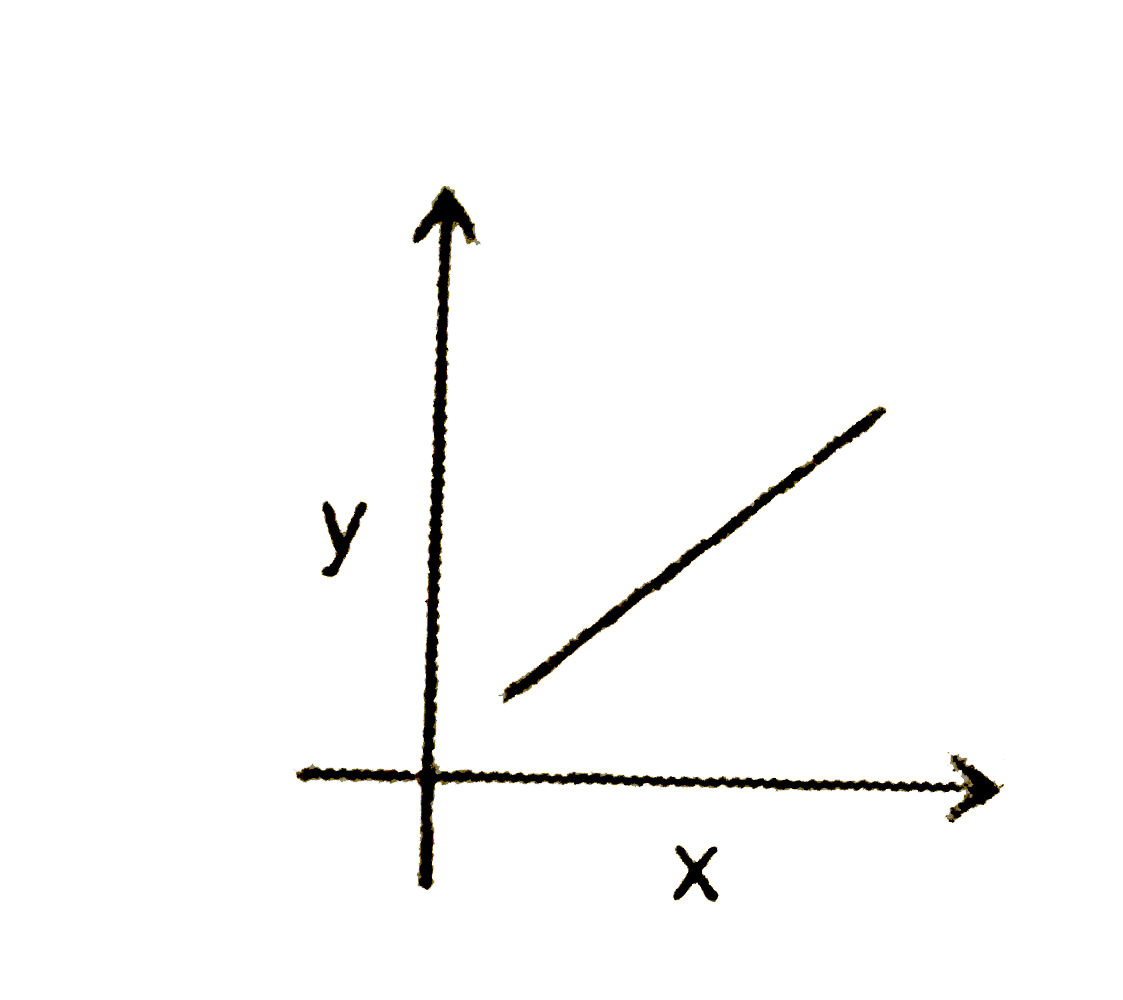
B
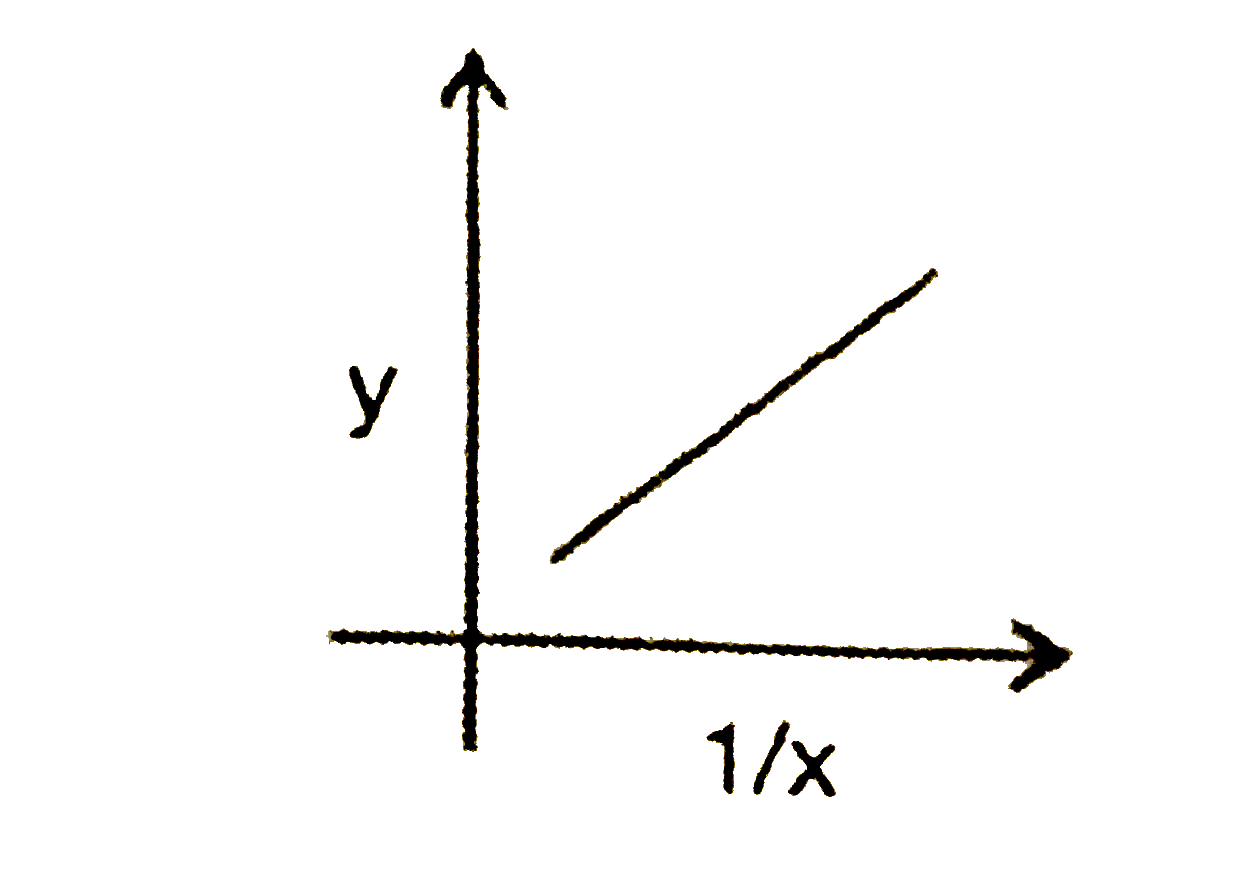
C
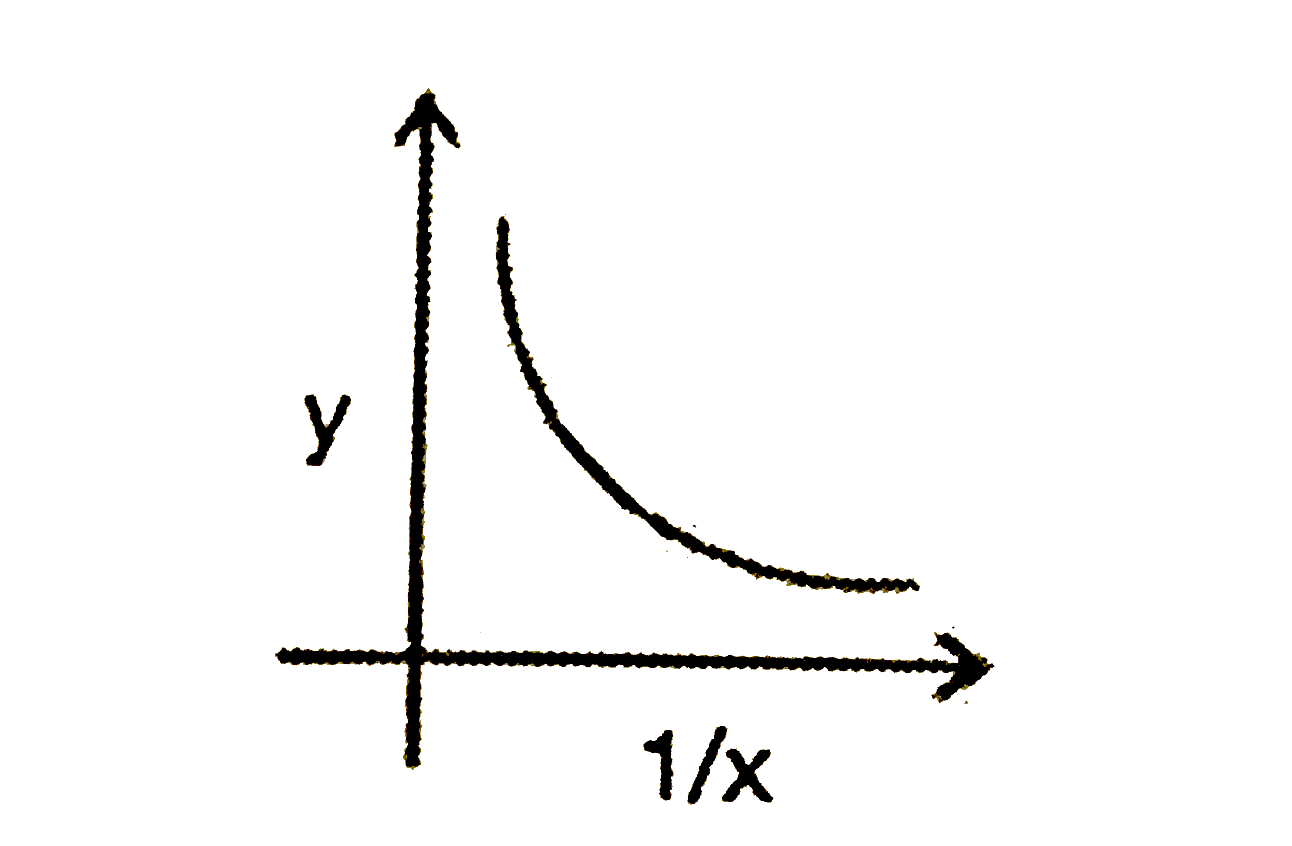
D
Text Solution
Verified by Experts
The correct Answer is:


Similar Questions
Explore conceptually related problems
Recommended Questions
- Two variables x and y very such that xy = constant. Which of the ...
Text Solution
|
- Two variables x and y very such that xy = constant. Which of the follo...
Text Solution
|
- xy((x)/(y)-y) Which of the following is equivalent to the expression...
Text Solution
|
- The graph of a pair of linear equations in two variables is represente...
Text Solution
|
- If the accomanying figure above shows the graph of function f, which o...
Text Solution
|
- The graph of the function f is shown above. Which of the following cou...
Text Solution
|
- Which of the four graphs above best shows the relationship between x a...
Text Solution
|
- y=-(x-3)^2+a In the equation above, a is a constant. The graph of th...
Text Solution
|
- Some values of x and their corresponding values of y are shown in the ...
Text Solution
|